PAKISTAN BUSINESS NEWS
BULLISH MOMENTUM RESUMES IN PAKISTAN STOCK MARKET
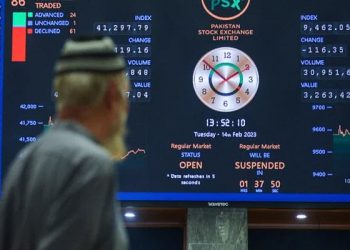
Pakistan’s stock market resumed its bullish momentum this week, with the benchmark KSE-100 index closing at 73,086, marking a gain of 1,183 points or 1.65% WoW (Week over Week).
This positive trend was driven by expectations of a potential rate cut as early as June, following the fourth consecutive decline in weekly inflation. Analysts anticipate that the Consumer Price Index (CPI)-based inflation for May could decrease to about 14-15% YoY (Year over Year), thereby expanding real interest rates to 7-8%.
Meanwhile, the Pakistani Rupee recorded a marginal gain of 0.03% WoW. In USD terms, the KSE-100 index gained 1.68% over the week.
Throughout the week, the KSE-100 index traded in a range of 1,124 points, reaching a high of 73,449 (+1,547) and a low of 72,325 (+423) points.
The average traded volume for the KSE-100 index was recorded at 279 million shares worth Rs14.45 billion, indicating an increase of 17.04% WoW in the number of shares traded, while there was a decrease of 1.86% WoW in traded value.
Overall trading volume on the Pakistan Stock Exchange (PSX) was recorded at 717 million shares worth Rs24.46 billion, showing a notable increase of 39.09% WoW in the number of shares traded, while there was a 2.35% WoW decrease in traded value.
The surge in the number of shares traded was largely influenced by WTL (Worldcall Telecom Limited) after it announced that its holding company, Global Tech Corporation (GTC), had commenced trading on NASDAQ.
On the economic front, Pakistan received a healthy remittance inflow of $2.81 billion in April, marking a significant 27.9% YoY increase.
Furthermore, the State Bank of Pakistan’s reserves have surged to nearly a two-year high, propelled by the final tranche under the International Monetary Fund’s SBA (Stand-By Arrangement) program.
TOP INDEX MOVERS AND FOREIGN INVESTMENT INSIGHTS
Sector-Specific Performance:
- The Pharmaceuticals sector emerged as the best performer, contributing 305 points to the index.
- Following Pharmaceuticals, other sectors that made notable positive contributions were Cement (259pts), Power Generation & Distribution (205pts), Technology & Communication (147pts), and Leather & Tanneries (126pts).
- On the contrary, negative contributions to the index came from sectors like Fertilizer (236pts), Oil & Gas Exploration Companies (103pts), Synthetic & Rayon (20pts), Tobacco (9pts), and Food & Personal Care Products (9pts).
Top Performing Stocks:
- Among individual stocks, SRVI, DAWH, HINOON, PAEL, and TRG were the top performers during the week, adding 126, 104, 87, 76, and 73 points to the index, respectively.
- Conversely, EFERT, MARI, ENGRO, OGDC, and MEBL collectively detracted 419 points from the index.
Foreign Investment Trends:
- Foreign investors continued to be net buyers during the week, acquiring $2.73 million worth of equities.
- Notably, Foreign Corporates dominated the buying activity, with a net investment of $2.67 million. Their significant capital allocation of $1.88 million went into the Fertilizer sector, while they divested from the All Other Sectors sector, with sales amounting to $1.17 million.
- Conversely, Other Organizations were the leading sellers, with a net sale of $4.72 million. Their substantial sales activity was primarily in the Fertilizer sector, amounting to $1.87 million.
Overall Market Performance:
- The KSE-100 index has seen remarkable gains, surging by 31,633 points or 76.31% during the fiscal year.
- Similarly, the ongoing calendar year has witnessed a cumulative increase of 10,634 points, equivalent to 17.03%, reflecting the overall bullish sentiment in the market.
PKR APPRECIATES AGAINST USD, MIXED PERFORMANCE AGAINST MAJOR CURRENCIES
The Pakistani rupee (PKR) demonstrated a modest appreciation of around 9 paisa against the US dollar this week, settling the trade at PKR 278.12 per USD, compared to the previous week’s closing of PKR 278.2 per USD. Notably, in today’s session alone, PKR gained 8 paisa against the USD.
Throughout Friday’s trading session, PKR witnessed an intraday high (bid) of 278.2 and a low (ask) of 278.
In the open market, exchange companies quoted the dollar at PKR 276.64 for buying and PKR 279.25 for selling.
However, when compared to major currencies, PKR experienced mixed performance:
- Against the Euro, PKR depreciated by 1.32 rupees, closing at PKR 299.94 compared to the previous value of PKR 298.62.
- The British Pound became more expensive by 1.49 rupees, closing at PKR 348.6 compared to 347.11 from the previous day.
- The Swiss franc saw gains of 89.18 paisa, closing at PKR 306.98 compared to PKR 306.09 from the previous session.
- Against the Japanese Yen, PKR lost 0.16 paisa, closing at 1.7869 versus 1.7853 a day ago.
- The Chinese Yuan experienced a slight decrease of 0.71 paisa, closing at 38.5 against 38.5 from the previous session.
- The Saudi Riyal closed at 74.16 with a loss of 2.03 paisa from its value of 74.18 a day ago.
- The U.A.E Dirham decreased in value by 2.17 paisa from 75.72 a day ago to 75.74.
During the current financial year, PKR has appreciated against the Dollar by 7.87 rupees or 2.83%. Similarly, the current calendar year has seen PKR appreciate by 3.74 rupees or 1.34%.
In the Money Market, the benchmark 6 Month Karachi Interbank Bid and Offer rates remained unchanged at 21.33% and 21.58%.
Additionally, the State Bank of Pakistan (SBP) conducted a reverse repo and Shariah Compliant Modarabah based Open Market Operation (OMO) today, injecting a total of Rs619.85 billion into the market.
GOLD PRICES SURGE IN PAKISTAN, REMAIN BELOW ACTUAL COST
Gold prices in Pakistan experienced a significant surge on Friday, mirroring the global uptrend, with 24-karat gold marking a notable increase of Rs4,600 to reach Rs243,800 per tola.
Of particular note is that the current price has been deliberately maintained Rs3,000 below its actual cost.
The Karachi Sarafa Association clarified this move, attributing it to a substantial decrease in purchasing power. Consequently, the price of gold today has been intentionally set below its real cost by Rs3,000.
Last week witnessed a contrasting scenario, with 24-karat gold plummeting by Rs6,400 per tola. This downturn extends the cumulative loss over the past fortnight to Rs14,200 per tola, representing a decline of 5.63%.
In tandem with the surge in 24-karat gold, the price of 24-karat silver also experienced an upswing. It was reported at Rs2,650 per tola and Rs2,271.94 per 10-gram, marking an increase of Rs30 per tola and Rs25.72 per 10-gram, respectively.
The Karachi Sarafa Association further disclosed that the price of 24-karat gold stands at Rs209,019 per 10-gram, reflecting a gain of Rs3,944. Similarly, the price of 22-karat gold witnessed an upward trend, quoted at Rs191,601 per 10-gram.
On the global front, international spot gold surged to $2,377 an ounce, marking a 1.31% increase for the day. This gain adds to yesterday’s rise of 1.61%, indicating a sustained bullish trend in the international gold market.
PAKISTAN’S MARKET STATS
Here’s a snapshot of the market data and economic indicators for the week ending May 10, 2024, compared to the previous week (May 3, 2024):
- PKR InterBank Exchange Rate:
- May 10, 2024: 278.1211 PKR/USD
- May 03, 2024: 278.2097 PKR/USD
- KSE100 Index:
- May 10, 2024: 73,085.50 points
- May 03, 2024: 71,902.09 points
- Average Daily Trading Volume (PKR):
- May 10, 2024: 717,343,635
- May 03, 2024: 515,753,952
- Gold Prices (Karachi) per 10 grams:
- May 10, 2024: 209,019 PKR
- May 03, 2024: 205,418 PKR
- KIBOR 6-Month Rate:
- May 10, 2024: 21.58%
- May 03, 2024: 21.60%
- 10-Year PIB Rate:
- May 10, 2024: 14.20%
- May 03, 2024: 14.17%
- Currency Exchange Rates (against USD):
- EUR: May 10, 2024 – 1.0771, May 03, 2024 – 1.0763
- GBP: May 10, 2024 – 1.2525, May 03, 2024 – 1.2547
- CHF: May 10, 2024 – 0.9065, May 03, 2024 – 0.9051
- JPY: May 10, 2024 – 155.774, May 03, 2024 – 152.999
- CNY: May 10, 2024 – 7.2268, May 03, 2024 – 7.2372
- Gold Prices (International):
- May 10, 2024: $2,360.54 per ounce
- May 03, 2024: $2,302.68 per ounce
- Silver Prices (International):
- May 10, 2024: $28.178 per ounce
- May 03, 2024: $26.557 per ounce
Here’s a summary of the open market rates and SBP data for May 10, 2024, compared to May 03, 2024:
Open Market Rates:
- USD: 279.25 PKR vs. 279.48 PKR
- EUR: 299.20 PKR vs. 297.48 PKR
- GBP: 347.77 PKR vs. 348.02 PKR
- JPY: 1.79 PKR vs. 1.80 PKR
- AED: 75.80 PKR vs. 75.70 PKR
- SAR: 74.07 PKR vs. 73.92 PKR
SBP Data – T-Bill Auction Cutoff Yield (Apr 30, 2024 vs. Apr 17, 2024):
- 3-Month: 21.6601% vs. 21.6601%
- 6-Month: 21.3849% vs. 21.3874%
- 12-Month: 20.8990% vs. 20.8989%
SBP Data – PIB Auction Cutoff Yield (Apr 16, 2024 vs. Mar 13, 2024):
- 3-Year: 16.6500% vs. 16.7800%
- 5-Year: 15.4800% vs. 15.4899%
- 10-Year: 14.3500% vs. 14.3500%
Interest Rate Corridor (Jun 27, 2023 vs. Apr 05, 2023):
- SBP Policy Rate: 22.00% vs. 21.00%
- SBP Reverse Repo Rate: 23.00% vs. 22.00%
- SBP Repo Rate: 21.00% vs. 20.00%
Here are the weekly and monthly indicators for various economic factors:
Weekly Indicators (May 03, 2024 – May 09, 2024):
- SBP FX Reserves: 9,120.30 million USD
- Bank FX Reserves: 5,338.60 million USD
- Total FX Reserves: 14,458.90 million USD
- SPI (Combined Group): 312.56
- WoW Change: -1.39%
- YoY Change: 22.32%
Monthly Indicators (April vs. March):
- Consumer Price Index (CPI): 263.32 (April) vs. 264.46 (March)
- MoM Change: -0.43%
- YoY Change: 17.34%
- Wholesale Price Index (WPI): 315.74 (April) vs. 317.95 (March)
- MoM Change: 0.70%
- YoY Change: 13.88%
- Sensitive Price Indicator (SPI): 323.96 (April) vs. 324.06 (March)
- MoM Change: -0.03%
- YoY Change: 28.77%
Trade Balance (April vs. March):
- Exports: 2,349.00 million USD (April) vs. 2,572.00 million USD (March)
- Imports: 4,723.00 million USD (April) vs. 4,873.00 million USD (March)
- Trade Balance: -2,374.00 million USD (April) vs. -2,301.00 million USD (March)
Home Remittances (April vs. March):
- Home Remittances: 2,811.86 million USD (April) vs. 2,953.98 million USD (March)
Total Foreign Investment (March vs. February):
- Total Foreign Investment: 311.20 million USD (March) vs. 151.53 million USD (February)
Current Account Balance (March vs. February):
- Current Account Balance: 619.00 million USD (March) vs. 98.00 million USD (February)
REER Index (March vs. February):
- REER Index: 104.0722 (March) vs. 102.0966 (February)
- MoM Change: 1.94%
- YoY Change: 21.57%
Large Scale Manufacturing Index (LSMI) (February vs. January):
- LSMI: 126.01 (February) vs. 131.45 (January)
- MoM Change: -4.14%
- YoY Change: 0.06%
Here are the quarterly and annual indicators for Pakistan’s economic performance:
Quarterly Indicators (Dec 31, 2023 vs. Sep 30, 2023):
- Pakistan’s External Debt: $131,159.10 million (Dec 31, 2023) vs. $129,742.00 million (Sep 30, 2023)
- National Accounts – Growth Rates (%):
- Agriculture: 5.02% (Q2 – FY24) vs. 8.58% (Q1 – FY24)
- Industry: -0.84% (Q2 – FY24) vs. -0.24% (Q1 – FY24)
- Services: 0.01% (Q2 – FY24) vs. 0.92% (Q1 – FY24)
- Total: 1.00% (Q2 – FY24) vs. 2.50% (Q1 – FY24)
Annual Indicators (FY23 vs. FY22):
- GDP Growth Rate: -0.17% (FY23) vs. 6.17% (FY22)
- Agriculture: 2.25% (FY23) vs. 4.28% (FY22)
- Manufacturing: -5.29% (FY23) vs. 10.86% (FY22)
- Commodity Sector: -0.50% (FY23) vs. 5.49% (FY22)
- Services Sector: 0.07% (FY23) vs. 6.66% (FY22)
- Budget Deficit (As % of GDP): -7.70% (FY23) vs. -7.90% (FY22)
- Total Debt & Liabilities (As % of GDP): 91.10% (FY23) vs. 89.70% (FY22)
- Total Debt & Liabilities (Rs. Billion): Rs. 77,104.10 billion (FY23) vs. Rs. 59,772.10 billion (FY22)
- Trade Balance (July – June): -$27,547.00 million (FY23) vs. -$48,354.00 million (FY22)
- Worker Remittances (July – June): $27,027.63 million (FY23) vs. $31,278.80 million (FY22)
- Foreign Investment (July – June): $429.67 million (FY23) vs. $1,857.84 million (FY22)
- Current Account Balance (July – June): -$2,387.00 million (FY23) vs. -$17,481.00 million (FY22)
- Annual Inflation Rate % (July – June): 29.18% (FY23) vs. 12.15% (FY22)


