

The breakthrough on the daily chart, surpassing a descending trend line as for oil Technical Analysis, signals a possible trend reversal, contingent on a close above the 75.61 level. Zooming into the 4-hour timeframe, confirmation requires surpassing 76.043. However, caution is paramount, as the once-resilient descending line must now act as a support level. This blog post decodes the intricacies of these chart patterns, empowering traders to navigate with precision in the ever-evolving financial markets.
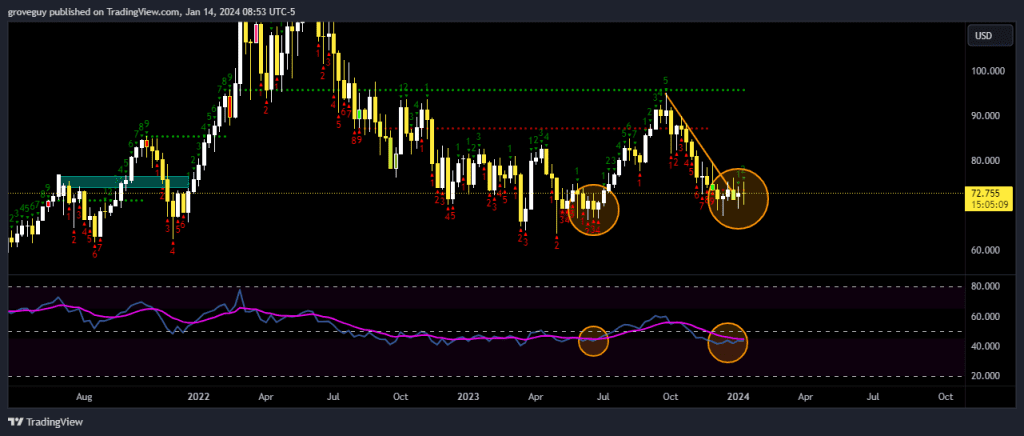
Interestingly we are very close to a potential Hidden Bullish Divergence on the weekly time frame as pointed out in the above given chart.
NOTE: Hidden Bullish divergence has yet to confirm. A local low on the weekly would imply the confirmation.
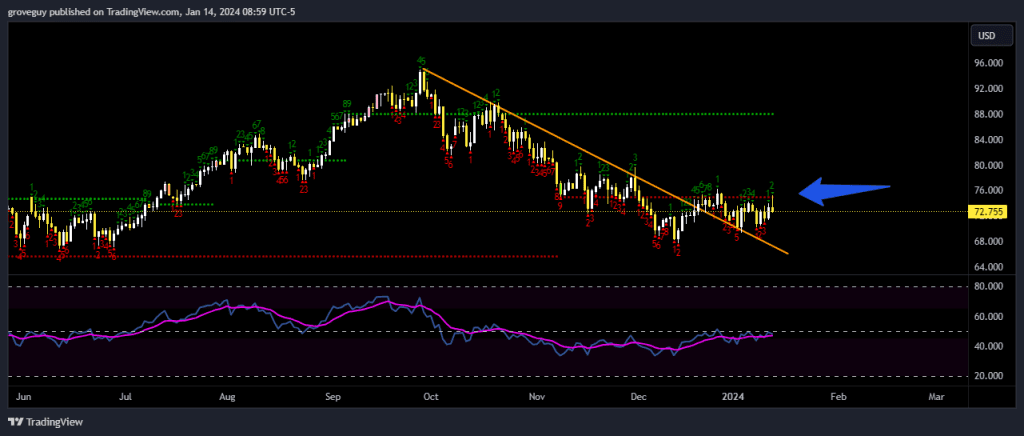
On the daily chart you can see that we have broken above the descending trend line. Now we need to close above the previous high after the break, as pointed out in the chart at 75.61 level.
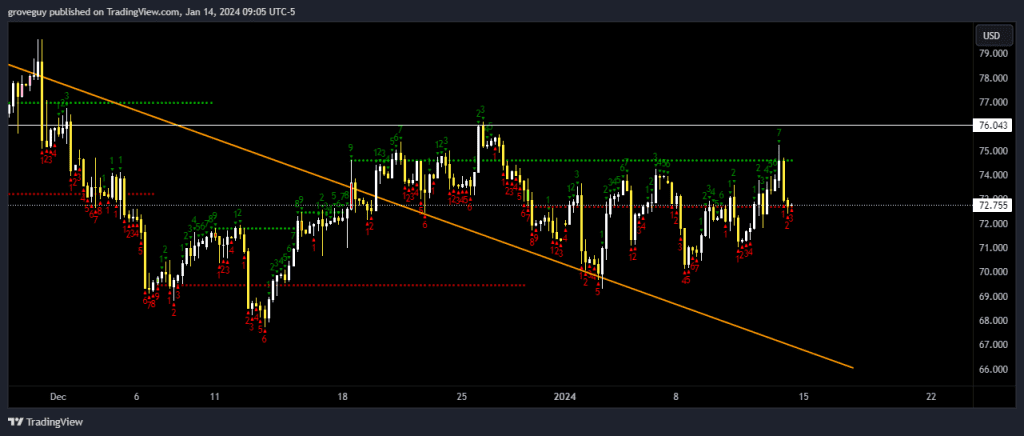
A close above 76.043 level is required on the 4hr time frame to confirm further movement to the upside.
NOTE: Descending line should stay as support for now. Any failure on the support level will nullify the aforementioned scenarios.