

The market has broken above the 0.236 Fibonacci level and closed the weekly candle below it, indicating a noteworthy development in the recent price action. The following candle has confirmed this level as strong resistance once more, as the accompanying chart shows. As of right now, the 276-277 level provides immediate support.
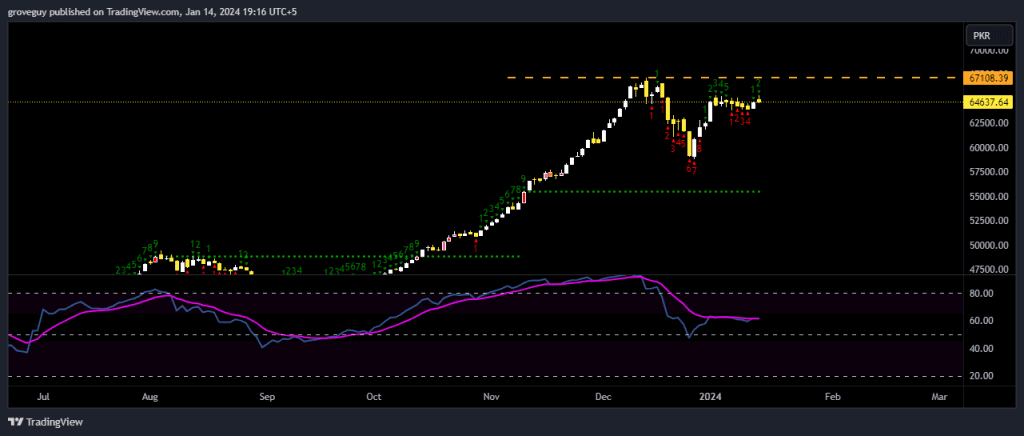
PAKISTANI RUPEE CEMENTS NINTH CONSECUTIVE WEEKLY GAIN, HITS 9-MONTH HIGH AGAINST US DOLLAR
It’s noteworthy that the 276-277 support level is undergoing its third test, potentially weakening its ability to sustain further downward pressure.
Analyzing the daily chart, there is a lack of divergence and limited market structure. This suggests that unless there is a decisive close above the 0.236 Fibonacci level, specifically at 283.0418, the likelihood of a descent to the next support level at 276-277 remains imminent. Traders and investors will be closely monitoring these key levels for potential shifts in market dynamics.
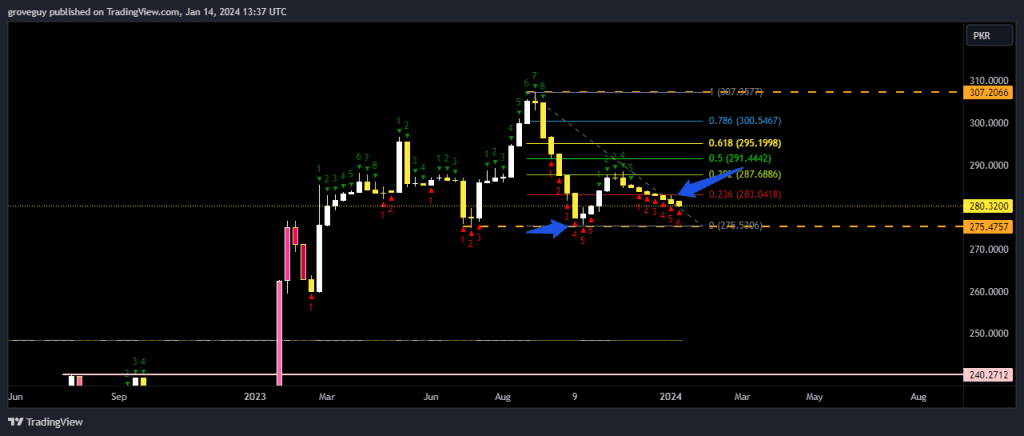
As you can see that we have broken the 0.236 Fibb level and closed below with a weekly candle and the following candle has also confirmed it as a resistance as shown in the chart. The next immediate support is at 276-277 level.
NOTE: The support at 276-277 level is now being tested for the 3rd time, making it less likely to hold.
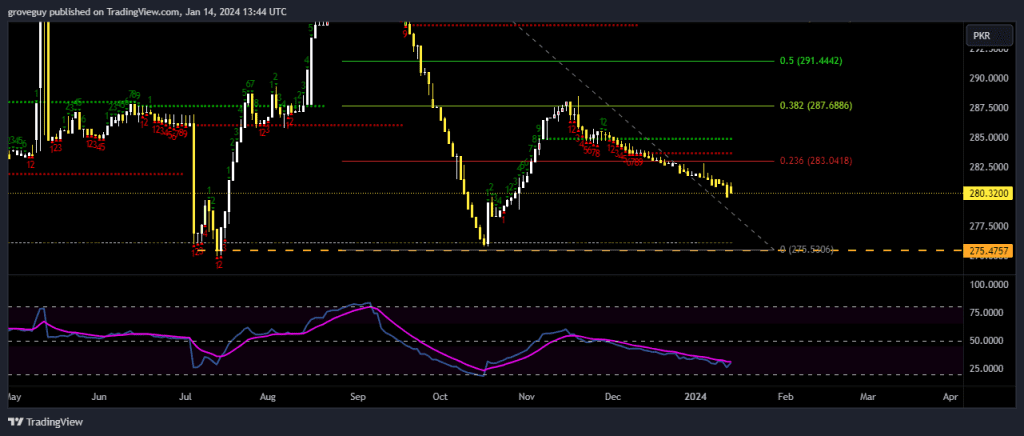
On the Daily chart there is no divergence in place and very little market structure. This indicates that until we close above the 0.236 fibb level at 283.0418 we are likely to touch down next support at 276-277 level.