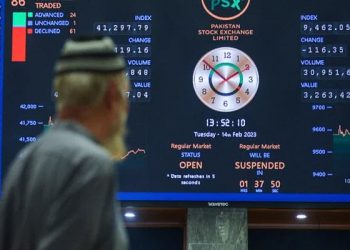
The Pakistan Stock Exchange (PSX) witnessed a notable extension in its rally, buoyed by a confluence of political clarity and encouraging inflation data. The benchmark KSE-100 Index experienced a significant uptick, ascending by 747 points, or 1.16%, to close at 65,325.69 on Friday. This upward movement is a testament to the market’s positive reaction to the unfolding political landscape and a favorable economic indicator, with February’s inflation cooling to the lowest level in the past 20 months.
The trading session was characterized by robust activity, with the index traversing a wide range of 956.25 points. It peaked at an intraday high of 65,486.46, representing a gain of 907.93 points, before dipping to a low of 64,530.21, down by 48.31 points. This volatility underscores the market’s reactive nature to both internal and external stimuli.
| PSX Market Summary (As of Mar 1, 2024 5:15 PM) | |
|---|---|
| Current Value | 65,325.68 |
| Change | 747.16 (1.16%) |
| High | 65,486.45 |
| Low | 64,530.20 |
| Volume | 136,075,582 |
| 1-Year Change | 60.62% |
| YTD Change | 1.03% |
| Previous Close | 64,578.52 |
| Day Range | 64,530.20 — 65,486.45 |
| 52-Week Range | 39,482.17 — 67,093.96 |
PKR EXCHANGE RATES FRIDAY, MARCH 01
VOLUME AND PARTICIPATION TRENDS
A total volume of 136.076 million shares was traded within the KSE-100 index, indicating active participation by investors. Among the index’s companies, 57 advanced, 39 declined, and 3 remained unchanged, while 1 did not trade. This distribution reflects a generally positive sentiment among investors, with more companies experiencing gains than losses.
SECTORAL PERFORMANCE: WINNERS AND LAGGARDS
The index’s ascent was predominantly supported by key sectors, including Commercial Banks, Fertilizers, Investment Banks/Companies/Securities, Oil & Gas Exploration, and Automobile Assemblers, contributing significantly to the index’s performance. Conversely, sectors such as Cement, Technology & Communication, Textile Composite, Pharmaceuticals, and Real Estate Investment Trust faced setbacks, pulling the index in the opposite direction.
TOP CONTRIBUTORS AND DETRACTORS
Notable companies that propelled the index upward included ENGRO, MEBL, MARI, DAWH, and BAHL, adding substantial points to the index. On the flip side, OGDC, LUCK, CHCC, SYS, and FCCL were among the primary detractors, limiting the index’s overall gain.
BROADER MARKET OVERVIEW
The All-Share index also reflected positive momentum, closing up with a net gain of 428.06 points at 43,268.95. The total market volume stood at 344.227 million shares, with 172 companies closing up, 156 closing down, and 20 unchanged out of 348 traded companies. Despite a decrease in traded value compared to the previous session, the market’s vibrant activity and the number of trades highlight investor engagement and market depth.
GOLD GAINS 1,100 WITNESSING GAIN FOR SECOND CONSECUTIVE DAY IN PAKISTAN
TECHNICAL ANALYSIS
The technical analysis of the KSE100 index suggests a strong bullish sentiment. As of the latest update, the summary of technical indicators and moving averages signals a “Strong Buy”. Here are the key points:
- Technical Indicators: The consensus among technical indicators is a “Strong Buy”, with 6 indicators signaling a buy and none suggesting a sell. Notable indicators include:
- RSI (14) at 81.031, indicating an overbought condition.
- STOCH (9,6) and STOCHRSI (14) also show overbought levels, which typically suggests strong buying interest but may also signal a potential pullback.
- MACD (12,26) presents a buy signal, suggesting positive momentum.
- ADX (14) at 64.584 signifies a strong trend.
- Other indicators like Williams %R, CCI (14), and the Bull/Bear Power (13) further support the buy sentiment.
- Moving Averages: All moving averages signal a “Strong Buy”, with 12 moving averages favoring a buy and none indicating a sell. This suggests a strong upward trend. Key moving averages include:
- Short-term moving averages (MA5, MA10) and longer-term averages (MA50, MA100, MA200) all support the bullish outlook, indicating sustained buying pressure.
Given these indicators, the KSE100 is currently experiencing a strong bullish trend, supported by both moving averages and technical indicators. However, the presence of overbought conditions suggests caution, as it may indicate potential volatility or a forthcoming correction.
Please remember, while this analysis provides a snapshot of current market sentiment and trends, financial markets are inherently unpredictable. It’s important to conduct your own research or consult a financial advisor before making investment decisions as the index is yet to conquer and retest its resistance.


