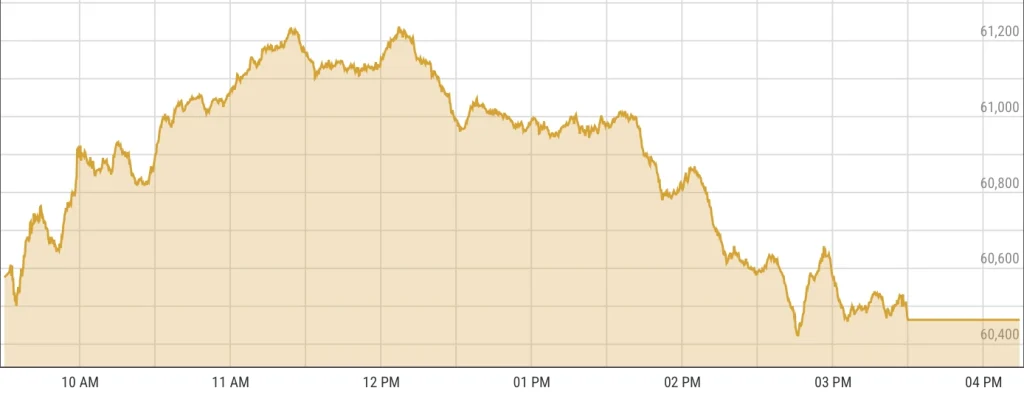
The Pakistan Stock Exchange witnessed a day of mixed fortunes as the benchmark KSE-100 index closed almost unchanged, erasing an early gain of 1.3%. The index’s performance was a tale of two sectors: a booming pharmaceutical sector and a lagging energy sector.
| Pakistan Stock Market Summary – Feb 20, 2024 | |
|---|---|
| Indicator | Value |
| Index Value | 60,464.24 |
| Change | 4.50 (0.01%) |
| High | 61,237.51 |
| Low | 60,420.83 |
| Volume | 234,890,909 |
| 1-Year Change | 48.66% |
| YTD Change | -6.49% |
| Previous Close | 60,459.74 |
| Day Range | 60,420.83 — 61,237.51 |
| 52-Week Range | 39,482.17 — 67,093.96 |
GOLD PRICES EDGE HIGHER AMID ANTICIPATION OF US FEDERAL RESERVE’S MEETING MINUTES
PHARMACEUTICAL SECTOR TAKES THE LEAD
In an impressive rally, pharmaceutical stocks surged by 7.5% across the board, hitting their upper limit in today’s session. This remarkable upswing came after the government announced a relaxation in drug pricing policies, sparking optimism among investors about the sector’s growth prospects.
ENERGY SECTOR APPLIES BRAKES
Conversely, oil and gas companies placed downward pressure on the market, offsetting the gains from the pharmaceutical sector. Despite the overall index’s attempt to climb, the energy sector’s struggles reflected broader concerns affecting these industries.
MARKET VOLATILITY AND POLITICAL CLIMATE
The market’s volatility is expected to remain high, influenced by the fluid political situation in the country. Arif Habib Limited highlighted the uncertainty and its impact on market sentiments, emphasizing the need for sustainable positive trends to emerge. Fitch Ratings also weighed in, suggesting that political uncertainties could complicate Pakistan’s negotiations with the International Monetary Fund (IMF) for future financing.
SECTORAL PERFORMANCE AND KEY CONTRIBUTORS
The KSE-100 index found support from various sectors, with pharmaceuticals leading the way, followed by gains in power generation & distribution, technology & communication, oil & gas marketing, and food & personal care products. However, the index faced headwinds from oil & gas exploration, commercial banks, textile composite, and cement sectors.
Notable companies contributing to the index’s performance included HUBC, SYS, PSO, HINOON, and SEARL, while OGDC, PPL, MARI, ILP, and PSEL were among those dragging it down.
GOLD PRICES EDGE HIGHER AMID ANTICIPATION OF US FEDERAL RESERVE’S MEETING MINUTES
BROADER MARKET OVERVIEW
In broader market activity, the All-Share index experienced a slight decline. Trading volume increased from the previous session, indicating heightened activity among investors. The economic backdrop features a current account deficit and significant foreign direct investment outflows, highlighting the challenges facing the economy.
MARKET PERFORMERS
Top Active Stocks
| SYMBOL | PRICE | CHANGE |
|---|---|---|
| BOP | 6.27 | 0.25 (4.15%) |
| PIAA | 11.10 | 0.04 (0.36%) |
| KEL | 4.26 | -0.04 (-0.93%) |
| WTL | 1.21 | -0.02 (-1.63%) |
| PRL | 25.18 | -0.15 (-0.59%) |
| UNITY | 20.61 | 1.31 (6.79%) |
| OGDC | 113.01 | -2.52 (-2.18%) |
| PAEL | 22.00 | -0.25 (-1.12%) |
| DFML | 15.63 | -0.88 (-5.33%) |
| PPL | 102.39 | -2.15 (-2.06%) |
Top Advancers
| SYMBOL | PRICE | CHANGE |
|---|---|---|
| PILDEF | 0.99 | 0.14 (16.47%) |
| GFIL | 7.50 | 0.87 (13.12%) |
| HAEL | 8.28 | 0.93 (12.65%) |
| ASTM | 7.59 | 0.84 (12.44%) |
| NCMLDEF | 4.15 | 0.45 (12.16%) |
| BILFDEF | 2.14 | 0.20 (9.90%) |
| HIRATDEF | 1.27 | 0.12 (9.84%) |
| HWQSDEF | 9.79 | 0.79 (8.78%) |
| PINL | 7.14 | 0.56 (8.51%) |
| GEMBLUEX | 19.73 | 1.38 (7.52%) |
Top Decliners
| SYMBOL | PRICE | CHANGE |
|---|---|---|
| FECM | 4.57 | -0.95 (-17.21%) |
| FIBLM | 3.10 | -0.50 (-13.89%) |
| HICL | 5.96 | -0.64 (-9.70%) |
| HIFA | 2.71 | -0.24 (-8.14%) |
| ARCTM | 15.60 | -1.27 (-7.53%) |
| JUBSDEF | 15.74 | -1.28 (-7.52%) |
| BELADEF | 42.67 | -3.46 (-7.50%) |
| GATIR | 27.75 | -2.25 (-7.50%) |
| IBFL | 379.26 | -30.74 (-7.50%) |
| SMLDEF | 34.60 | -2.76 (-7.39%) |


