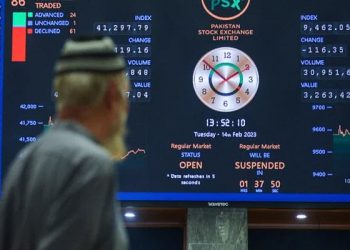
The Pakistan Stock Exchange (PSX) benchmark KSE-100 index experienced a notable uptick in Monday’s trading, encapsulating the dynamic forces at play within the market. With a significant rise of 586.79 points, marking a 0.98% increase, the index closed at 60,459.75. This movement highlights the inherent volatility and the positive sentiment pervading the market, as evidenced by the day’s wide trading range and the performance of key sectors.
The Pakistan Stock Market has been trading on a negative trajectory. Moreover, it could be a trap or an indication of follow up rally because of the unclear Pakistan’s General Election 2024.
Recently a confession that’s stirred the political and legal circles, Rawalpindi Commissioner Liaquat Ali Chattha drops a bombshell, claiming election rigging and pointing fingers at high offices. This twist has seen him swiftly reassigned, sparking a frenzy of denials and the launch of an investigation. The drama unfolds, leaving us pondering the ripple effects on Markets, Governance and Transparency.
In the latest trading session, the Pakistani rupee (PKR) showcased a modest but noteworthy appreciation against the US dollar, marking a positive shift in its exchange rate dynamics. By the close of Monday’s interbank session, the PKR strengthened by 0.46 paisa, positioning itself more favourably at PKR 279.36 per USD.
VOLATILITY AND PERFORMANCE
The trading session was marked by a broad fluctuation, with the index navigating a range of 1,312.62 points, peaking at an intraday high of 60,504.48 and dipping to a low of 59,191.86. Such volatility underscores the dynamic nature of the market, driven by diverse investor sentiments and strategic plays across sectors.
| Parameter | Value |
|---|---|
| Current Value | 60,459.74 |
| Change | 586.78 (0.98%) |
| High | 60,504.48 |
| Low | 59,191.85 |
| Volume | 126,222,530 |
| 1-Year Change | 47.04% |
| YTD Change | -6.50% |
| Previous Close | 59,872.96 |
| Day Range | 59,191.85 — 60,504.48 |
| 52-Week Range | 39,482.17 — 67,093.96 |
SECTORAL CONTRIBUTIONS
The day’s gains were primarily fueled by significant contributions from pivotal sectors:
- Oil & Gas Exploration Companies led the charge with a substantial 267.91 points.
- Power Generation & Distribution followed with an 86.13 point increase.
- The Cement, Oil & Gas Marketing Companies, and Automobile Assembler sectors also made noteworthy contributions, adding 58.05, 53.47, and 40.57 points, respectively.
Conversely, the index faced resistance from sectors like Chemicals, Investment Banking, Leather & Tanneries, Property, and Paper & Board, which slightly dampened the overall market momentum.
LEADING MARKET MOVERS
Among the 100 index companies, there was a balanced mix of performances:
- 51 companies advanced,
- 38 declined,
- 3 remained unchanged,
- and 8 did not trade.
Key contributors to the index’s ascent included OGDC, PPL, HUBC, ENGRO, and BAHL, whereas UBL, NESTLE, COLG, DAWH, and POL were the primary detractors.
BROADER MARKET OUTLOOK
The All-Share index also mirrored this upward trajectory, closing with a net gain of 406.15 points at 40,792.93. However, the total market volume saw a decrease compared to the previous session, highlighting a shift in investor participation and strategy.
PSX MARKET PERFORMERS
| Symbol | Price | Change |
|---|---|---|
| Top Active Stocks | ||
| PIAA | 11.06 | 0.89 (8.75%) |
| WTL | 1.23 | 0.02 (1.65%) |
| PRL | 25.33 | 1.14 (4.71%) |
| CNERGY | 3.95 | 0.26 (7.05%) |
| KEL | 4.30 | 0.20 (4.88%) |
| OGDC | 115.53 | 7.60 (7.04%) |
| PPL | 104.54 | 6.31 (6.42%) |
| BOP | 6.02 | 0.14 (2.38%) |
| FFBL | 24.21 | -0.94 (-3.74%) |
| DCL | 7.73 | 0.36 (4.89%) |
| Top Advancers | ||
| FECM | 5.52 | 0.99 (21.85%) |
| FPJM | 1.90 | 0.20 (11.77%) |
| LSEPL | 3.42 | 0.34 (11.04%) |
| BAPLDEF | 10.65 | 1.00 (10.36%) |
| QUETDEF | 7.30 | 0.66 (9.94%) |
| UCAPM | 2.08 | 0.17 (8.90%) |
| PIAA | 11.06 | 0.89 (8.75%) |
| PILDEF | 0.85 | 0.06 (7.60%) |
| GEMBLUEX | 18.35 | 1.28 (7.50%) |
| SCL | 258.78 | 18.04 (7.49%) |
| Top Decliners | ||
| SGPLDEF | 2.17 | -0.97 (-32.44%) |
| SLLDEF | 1.90 | -0.33 (-14.80%) |
| HIRATDEF | 1.22 | -0.14 (-10.37%) |
| QUICE | 4.20 | -0.40 (-8.70%) |
| TSMF | 4.60 | -0.39 (-7.82%) |
| IML | 12.00 | -1.00 (-7.69%) |
| JUBSDEF | 17.02 | -1.38 (-7.50%) |
| PECODEF | 471.75 | -38.25 (-7.50%) |
| BELADEF | 46.13 | -3.74 (-7.50%) |
| GATIR | 30.00 | -2.41 (-7.44%) |
Looking ahead, the KSE-100’s impressive fiscal year gain of 45.85% contrasts with a modest 3.19% decrease in the ongoing calendar year. This dichotomy presents a complex landscape for market analysts and investors alike, suggesting that while the market has robust growth potential, it also faces challenges that could affect its trajectory.


