
Gold prices have entered a period of consolidation in early European trading on Wednesday, sticking closely to recent highs and hovering near record levels. The precious metal’s movements are currently restrained, as market participants hold off on making significant moves until more information surfaces regarding the Federal Reserve’s (Fed) plans for interest rate adjustments.
In the latest trading session, the gold market in Pakistan witnessed a significant uptick in prices, capturing the attention of investors and consumers alike. According to the All Sindh Sarafa Jewellers Association, the price of per tola 24 karat gold saw a notable increase of Rs1,500, closing at Rs225,400 compared to the previous trading day’s Rs223,900.
The momentum was not limited to per tola measurements alone; 10 grams of 24 karat gold also experienced a substantial rise, increasing by Rs1,286 to settle at Rs193,244, up from Rs191,958. This shift indicates a growing trend in the precious metals market, reflecting both local and international factors influencing gold prices.
The surge in gold prices extended to 22 karat gold, with 10 grams ascending to Rs177,140 from Rs175,962. Despite the noticeable uptrend in gold rates, the prices of silver remained stable, with per tola and ten-gram measurements holding steady at Rs2,600 and Rs2,229.08, respectively. This stability in silver prices amidst rising gold rates presents an intriguing contrast within the precious metals market.
EYES ON THE FEDERAL RESERVE
The investment community’s attention is squarely focused on the upcoming congressional testimony by Fed Chair Jerome Powell. This eagerly anticipated event is expected to shed light on the central bank’s stance toward future interest rate policies, which will, in turn, influence the US Dollar’s (USD) performance and provide fresh momentum for gold, a traditionally non-yielding asset.
Adding to the day’s anticipation, traders are gearing up for the release of crucial US economic data, including the ADP report on private-sector employment and the JOLTS Job Openings figures. These reports, due to be released during the early North American session, will offer further insights into the health of the US economy and potentially impact the Fed’s interest rate trajectory.
The prevailing sentiment that the Fed may commence interest rate cuts as early as June is a significant factor underpinning gold prices. This outlook has been reinforced by recent disappointing US macroeconomic data, which has kept USD bulls at bay and, by extension, provided a boost to gold prices. Additionally, ongoing geopolitical tensions and concerns over an economic slowdown in China are expected to provide a floor for gold prices, underscoring its status as a safe-haven asset in times of uncertainty.
GOLD’S TECHNICAL TERRAIN: A CLOSER LOOK AT RSI AND KEY PRICE LEVELS
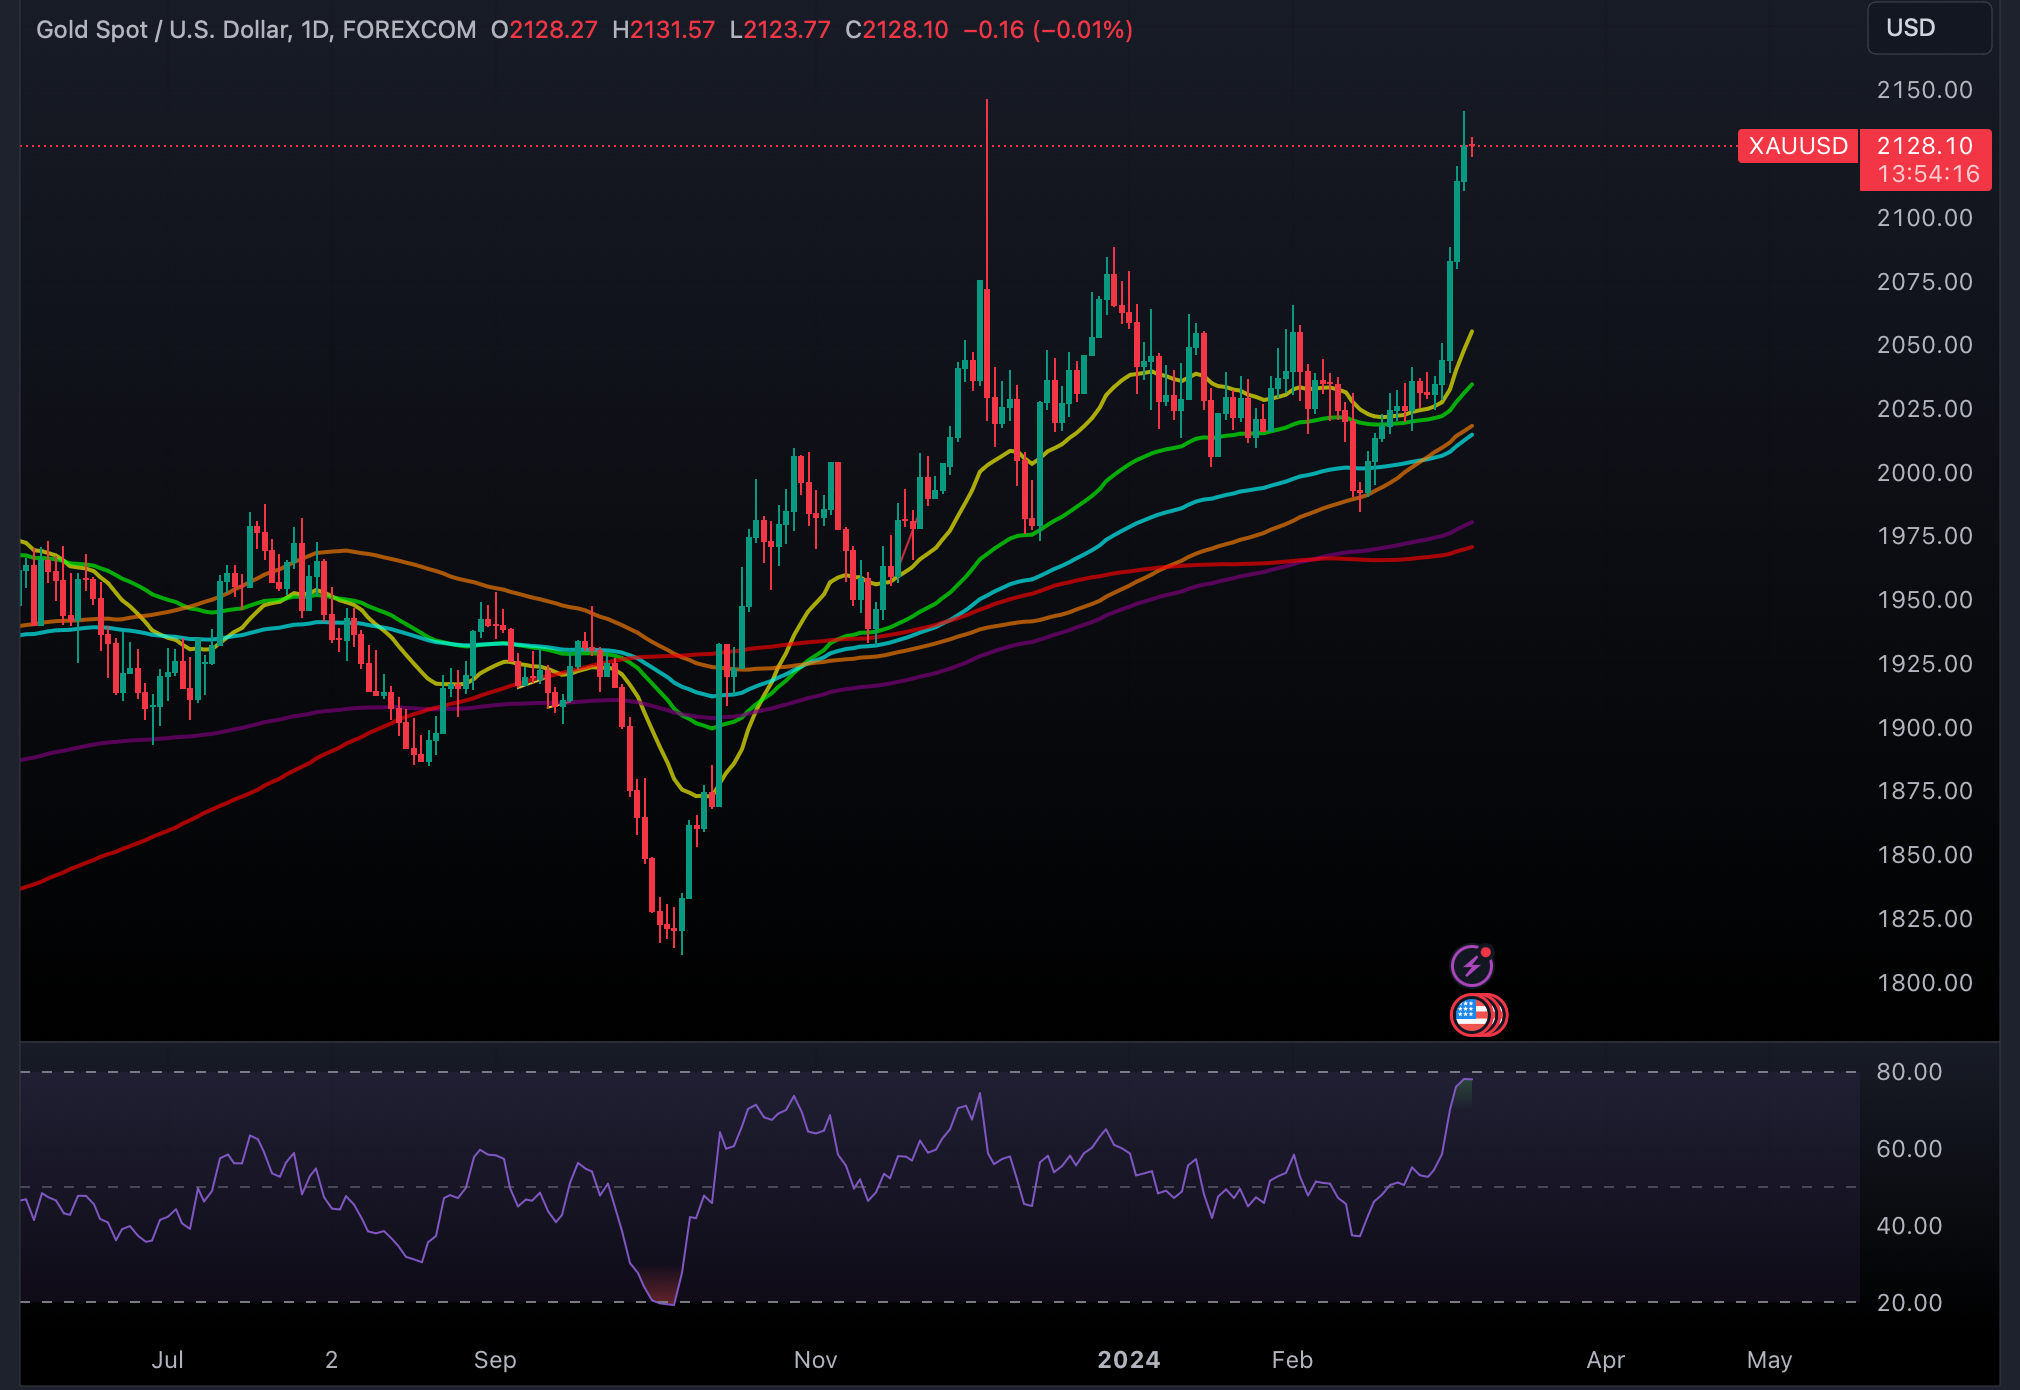
In the realm of gold trading, technical analysis serves as a compass for navigating market movements, with the Relative Strength Index (RSI) being one of the key indicators to watch. As of late, gold’s journey on the price chart has hit a phase of consolidation, attributed to the overbought conditions signaled by the RSI on the daily chart. This scenario calls for a strategic pause among bullish traders, suggesting a moment of reflection before embarking on further investments.
RSI SIGNALS
The RSI, an essential tool for assessing market momentum, has reached a level indicating that gold is potentially overstretched in its current ascent. This development advises caution, proposing that a brief period of consolidation or a slight pullback might be on the horizon for gold prices. Such a correction, however, is not necessarily a signal for concern but rather a potential setup for future gains.
SUPPORT AND RESISTANCE
In the event of a corrective slide, the $2,100 mark stands as a robust round-figure support level, poised to cushion gold’s descent. Should prices retract further, the range between $2,064 and $2,062 emerges as a significant zone of strong horizontal resistance-turned-support, pivotal for determining gold’s short-term trajectory.
A decisive breach below this threshold could signal a temporary peak in gold prices, shifting the near-term market sentiment to favor bearish traders. Conversely, the resistance band at $2,142 to $2,144, which coincides with the all-time highs retested recently, poses a challenge for gold’s upward momentum.
THE ROAD AHEAD
Should gold manage to break through this resistance, it could enter uncharted territory, unlocking the door to further appreciation with the $2,200 level as the next psychological milestone. This potential advancement underscores the dynamic nature of gold trading, where technical indicators like the RSI play a crucial role in shaping investment strategies.
XAUUSD posted an intraday high of $2131.57 and intraday low of $2079.55. Gold is currently trading at $2123.77 (1:05pm Wednesday, 06 March 2024 (GMT+5) Time in Pakistan). The weekly session on Friday, 29 February, 2024 closed at $2082.84 gaining (1.87%) for the day and (2.31%) for the week.