
Gold prices broke above an unprecedented level of $2,180 during early trading hours in New York on Friday, in a stunning spike that attracted the attention of investors worldwide. The 10-year U.S. Treasury yield dropped to 4.04% after the announcement of the country’s Nonfarm Payrolls (NFP) statistics, which precipitated this notable increase. Unexpected economic data, such as slower wage growth and higher unemployment rates, have created the conditions for the much anticipated Federal Reserve meeting in June, where a rate cut is now more likely.
Gold price (XAU/USD) closed at $2179.17 on Friday March 08, 2024 marking a daily increase of (+0.89%) and a weekly gain of $96.33 and (+4.62%). Technical analysis at the end of the article.
UNVEILING THE NUMBERS
The Bureau of Labor Statistics (BLS) revealed a nuanced picture of the U.S. labor market, with the Unemployment Rate edging up to 3.9%, against the forecasted 3.7%. Despite this, February saw a commendable addition of 275K jobs, surpassing the 200K expectations but still trailing behind January’s impressive 353K figure.
WAGES AND INFLATION: A CLOSER LOOK
The narrative of cooling inflation gained further traction as Average Hourly Earnings increased by a mere 0.1% month-over-month, a stark contrast to the 0.6% rise seen in January. The anticipated wage growth, expected to decelerate to 0.3%, instead slowed more sharply. Year-on-year wage growth also saw a slight deceleration, settling at 4.3% from a projected and previous figure of 4.4%, with January’s numbers revised down from 4.5%.
JOBS REPORT PRE-RELEASE CHECKLIST – MARCH 8
The table that summarises the US Jobs Report indicators, their assessments (positive, negative, or neutral), and the details:
| Indicator | Assessment | Details |
|---|---|---|
| Previous Non-Farm Payrolls | Positive | Nonfarm Payrolls rose by 353,000 in January, almost doubling the market expectation of a 180,000 increase. |
| Challenger Job Cuts | Negative | US employers announced 84,638 job cuts in February, an increase compared to the previous month and to the same month a year ago. February’s total number of cuts was actually the highest for the month since 2009. |
| Initial Jobless Claims | Neutral | The number of people filing for unemployment benefits for the first time has increased slightly in the last month, but remains low by historical standards. The 4-week moving average until February 23 was at 212,250, slightly up from the 207,750 average at the end of January. |
| Continuing Jobless Claims | Negative | The overall number of people in the US collecting unemployment benefits rose more than expected to 1.906 million in the week ending February 23. This is the first time the figure exceeds the 1.9 million threshold since late November. |
| ISM Services PMI | Negative | The ISM Services PMI data for February suggested a slowdown in the service sector’s activity. The employment subindex fell to 48.0 from 50.5 a month earlier, suggesting that on average employers shed jobs during the month. |
| ISM Manufacturing PMI | Negative | The headline Manufacturing PMI fell further into contraction territory. The Employment component signaled job losses persisted for the fifth month in a row, and at a faster pace. |
| University of Michigan Consumer Confidence Index | Neutral | The University of Michigan Consumer Sentiment index fell slightly in February but broadly held its gains over the past three months. |
| Conference Board Consumer Confidence Index | Neutral | The Conference Board Consumer Confidence Index also fell slightly in February, and consumers said they were more concerned about the labor market’s current situation and future conditions. |
| ADP Employment Report | Neutral | ADP’s gauge of private-sector employment increased by 140,000 in February. This was better than the 111,000 jobs created in January, but it missed market estimates of a 150,000 rise. |
| JOLTS Job Openings | Neutral | Job openings in the US declined to 8.86 million in January from over 9 million in December. This signals that labor market conditions are cooling slightly, but the numbers are still far above prepandemic levels. |
THE DOLLAR UNDER PRESSURE
These developments have not been kind to the U.S. Dollar, which faced downward pressure, pushing the U.S. Dollar Index (DXY) to refresh its seven-week lows around 102.40. This selling pressure was exacerbated by the anticipation of a more dovish stance from the Federal Reserve, especially in light of Federal Reserve Chair Jerome Powell’s remarks. During his testimony before Congress, Powell hinted at the central bank’s nearing confidence in inflation’s return to the 2% target, suggesting a potential easing of monetary policy restrictions to avoid economic recession.
GOLD’S GLITTERING PERFORMANCE
Gold’s bullish momentum didn’t just stop at breaking past the December 4 high of $2,145; it continued its ascent, marking an eighth consecutive session of gains. With the precious metal now exploring new heights, the market sentiment remains overwhelmingly bullish. However, traders are on the lookout for possible corrections, as indicated by momentum oscillators like the 14-period Relative Strength Index (RSI) hitting an overbought level of 83.00, signaling potential for a pullback.
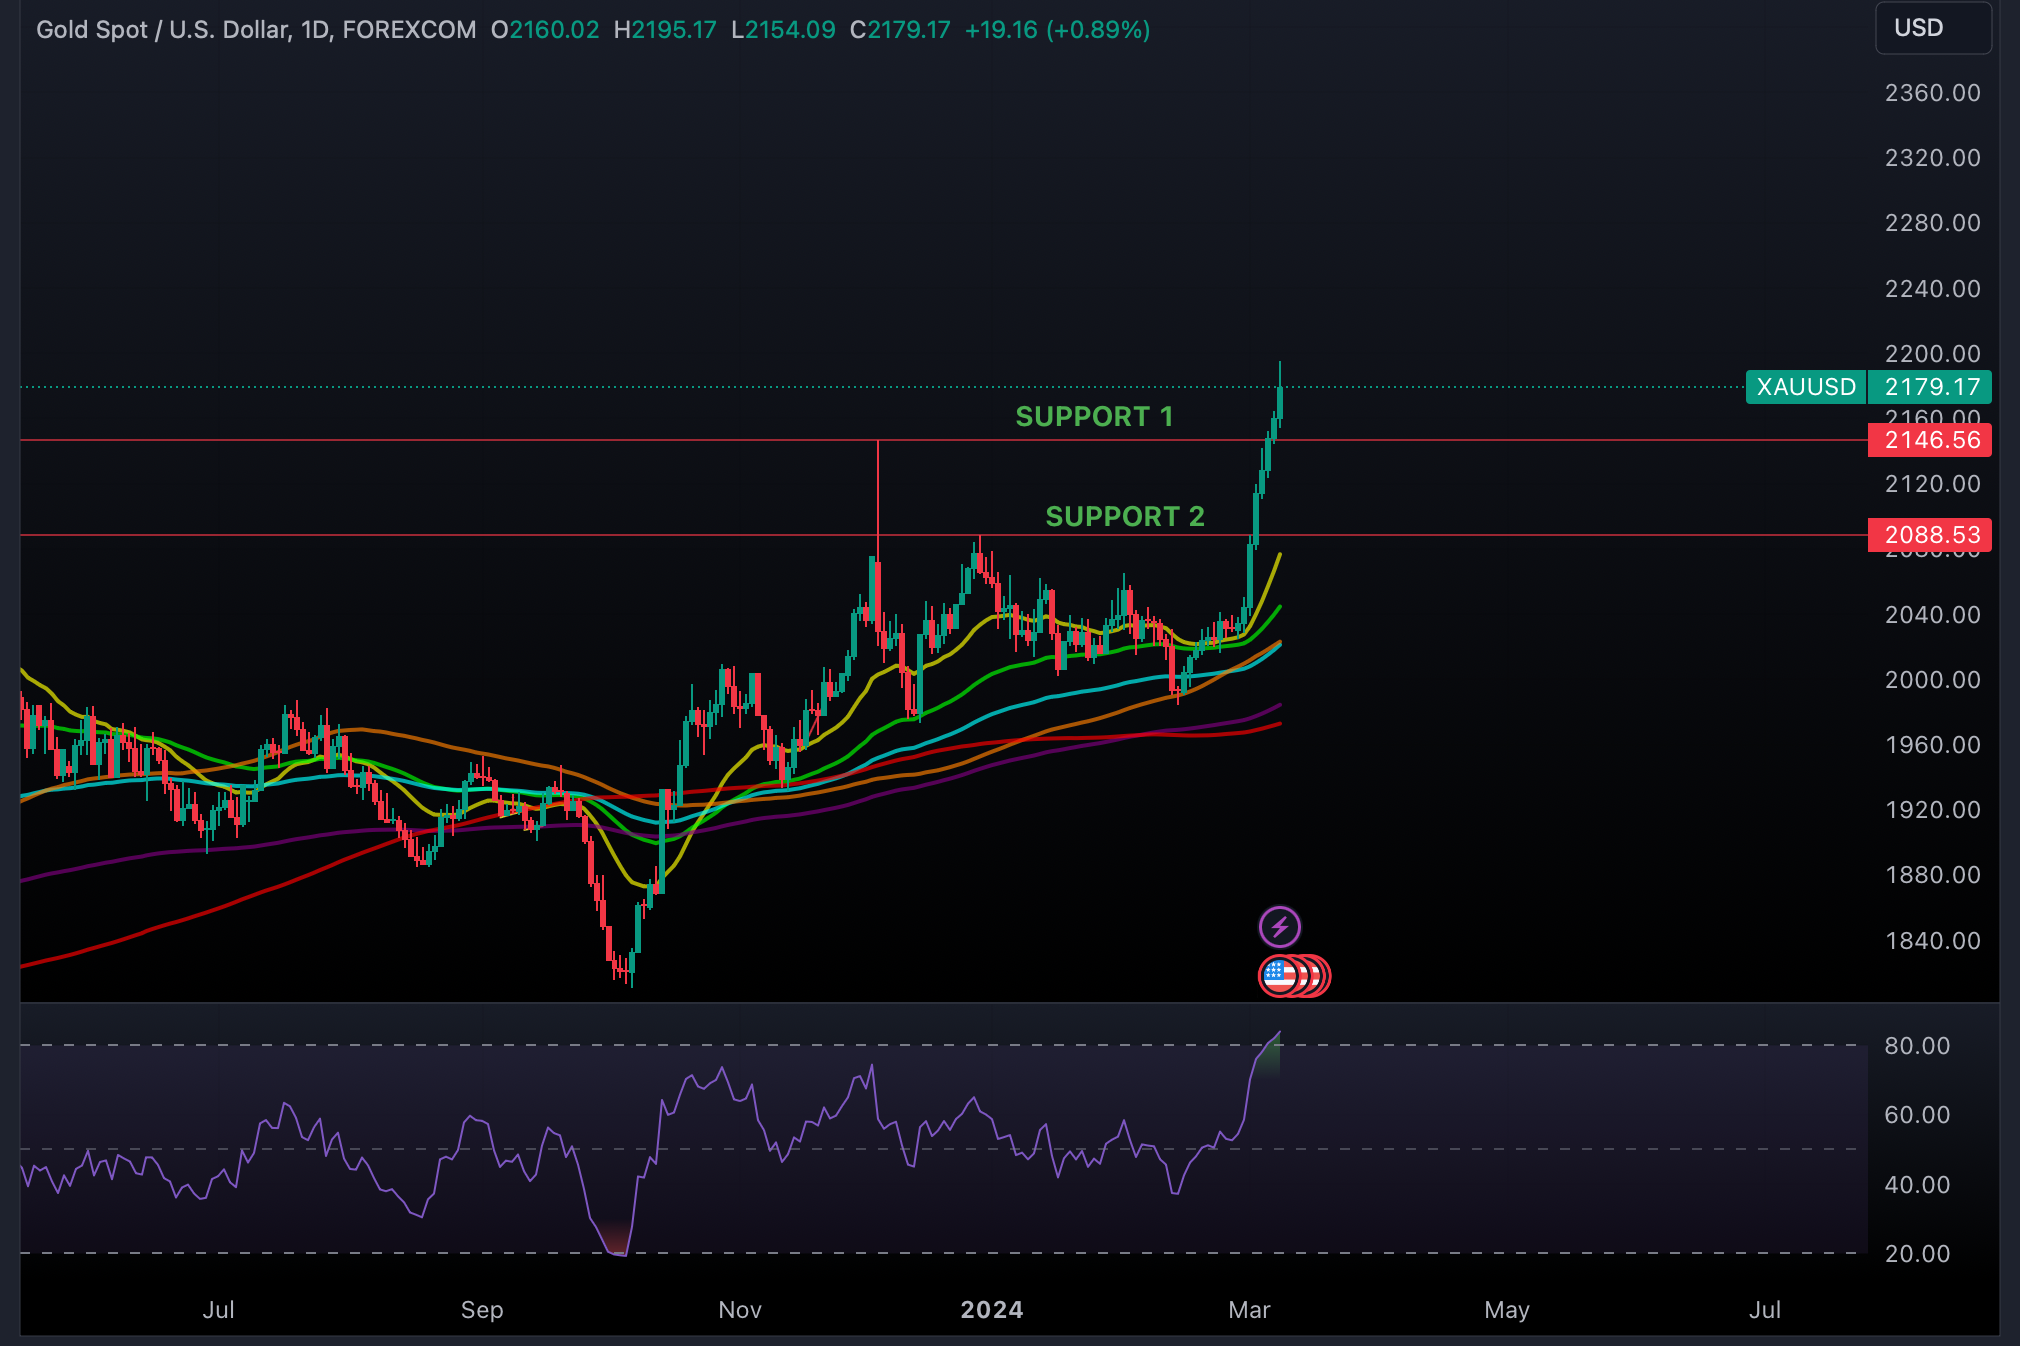
SUPPORT LEVELS TO WATCH | TECHNICAL ANALYSIS
Even as gold revels in uncharted territory, the savvy investor keeps an eye on key support levels that could cushion any potential downside. The December 4 high near $2,145 and the December 28 high at $2,088 are pegged as critical support levels, providing a strategic backdrop for gold’s spectacular journey through the markets.
This Friday is the eighth trading session that the gold price will continue its upward trend. Following a break over the horizontal resistance line drawn from the high on December 4 near $2,145, the precious metal has renewed its all-time highs above $2,180.00.
Although the price of gold is currently trading in unfamiliar ground, a general bull market is predicted to continue. Nonetheless, as momentum indicators have entered the overbought area, a correction in the asset cannot be completely ruled out. Having risen beyond the 70.00 threshold, the 14-period Relative Strength Index (RSI) indicates overbought levels and suggests a correction may be on the horizon.
Important support levels will be found on the downside at the highs of December 4 at $2,145 and December 28 at $2,088.