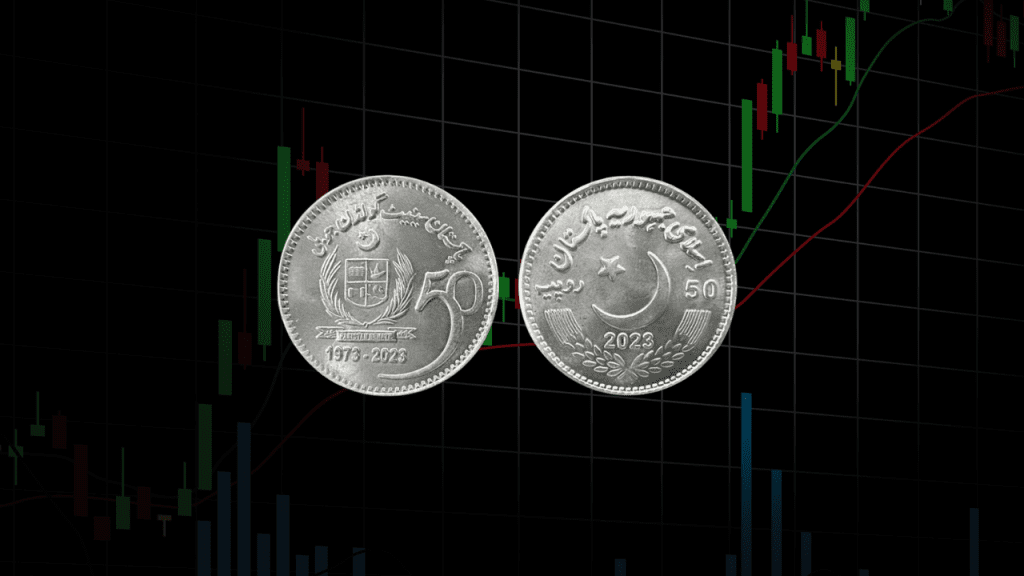
The Pakistani rupee (PKR) experienced a slight depreciation of 14 paisa against the US dollar in Thursday’s interbank session, settling at PKR 278.4 per USD compared to the previous session’s closing of PKR 278.26 per USD. The currency witnessed fluctuations throughout the day, with an intraday high of 278.65 and a low of 278.45.
In the open market, exchange companies quoted the dollar at 276.96 for buying and 279.45 for selling.
Against major currencies, the PKR saw mixed movements. Notably, it lost 1.46 rupees against the Euro, closing at 302.71, and the British Pound became more expensive by 2.56 rupees, closing at 353. The Swiss franc saw gains of 1.95 rupees, closing at 309.3.
However, the PKR lost ground against the Japanese Yen, losing 2 paisa, and the Chinese Yuan gained 5 paisa. The Saudi Riyal and the U.A.E Dirham both saw gains in value.
In terms of yearly performance, the PKR has appreciated against the Dollar during the current financial year, gaining 7.59 rupees or 2.72%. In the current calendar year, it has appreciated by 3.46 rupees or 1.24%.
In the Money Market, benchmark 6 Month Karachi Interbank Bid and Offer rates fell by 21 basis points to 21.1% and 21.35%, attributed to a previous auction where cut-off yields dropped by up to 49 basis points.
Additionally, the State Bank of Pakistan (SBP) conducted a reverse repo-based Open Market Operation (OMO), injecting a total of Rs913.35 billion into the market.
he Pakistani Rupee (PKR) might be poised for a shift from its unusually calm trading period, based on technical analysis and historical trends.
SIGNS OF CHANGE:
- Low Volatility: Uncharacteristically low volatility has been observed in the PKR/USD pair this year, with 10-day and 30-day annualized volatility remaining flat. This is a significant departure from historical averages.
- Cooling Depreciation: The PKR’s depreciation against the USD has slowed down compared to past years. The year-to-date gain of 2.7% contrasts with the typical 5-year average depreciation of 14.7%.
Technical Indicators Suggesting Potential Movement:
- RSI Rebound: The Relative Strength Index (RSI) for the PKR/USD pair is a technical indicator measuring momentum. After falling to an oversold level of 10 in February, the RSI has rebounded to 56, hinting at a possible reversal in the exchange rate.
- Historical RSI Trends: There have only been three instances since 2000 where the RSI dipped below 10. In those cases, when the RSI went back above 60 (indicating stronger momentum), the PKR typically depreciated by 3.7% against the USD over the next three months.
Important Caveats:
- RSI Limitations: The RSI is just one indicator, and its readings should not be interpreted in isolation. It’s crucial to consider other factors when making investment decisions.
- Disclaimer Included: The article clearly states that the analysis is for informational purposes only and does not constitute financial advice.
Overall, the Pakistani Rupee seems to be hinting at a potential breakout from its recent period of low volatility. While the precise direction of the movement remains uncertain, the technical indicators and historical trends suggest a possibility of depreciation in the coming months. Investors and traders should carefully consider all relevant factors before making any currency-related decisions.