Market Performance (May 31, 2024 – May 24, 2024)
- PKR InterBank: The Pakistani Rupee slightly depreciated to 278.3263 from 278.2097.
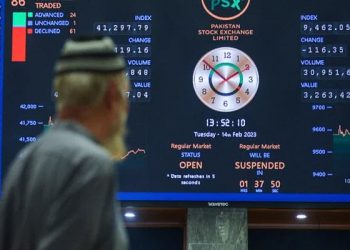
- KSE100 Index: The Karachi Stock Exchange 100 Index decreased marginally to 75,878.48 from 75,983.04.
- Average Daily Volume: Trading volume dropped significantly to 447,005,090 from 558,188,175.
- Gold (Karachi) Rs/10 gm: Gold prices increased to 207,219 from 205,933.
- KIBOR 6M: The Karachi Interbank Offered Rate for 6 months fell to 21.02 from 21.27.
- 10Y PIB: The yield on the 10-year Pakistan Investment Bond remained stable at 14.14.
- Foreign Exchange Rates:
- EUR/USD: Slightly increased to 1.0848 from 1.0846.
- GBP/USD: Rose to 1.2742 from 1.2738.
- CHF/USD: Dropped to 0.9024 from 0.9147.
- JPY/USD: Increased to 157.285 from 156.996.
- CNY/USD: Slightly up to 7.242 from 7.2412.
- Precious Metals:
- Gold (USD/oz): Decreased to 2,327.82 from 2,334.23.
- Silver (USD/oz): Increased to 30.408 from 30.356.
Open Market Rates (May 31, 2024 – May 24, 2024)
- USD/PKR: Slightly depreciated to 279.49 from 279.55.
- EUR/PKR: Increased to 301.33 from 300.48.
- GBP/PKR: Rose to 354.36 from 352.96.
- JPY/PKR: Remained unchanged at 1.78.
- AED/PKR: Increased to 75.98 from 75.91.
- SAR/PKR: Rose to 74.20 from 74.11.
State Bank of Pakistan (SBP) Data
- T-Bill Auction Cutoff Yield (May 29, 2024 vs. May 15, 2024):
- 3M: Decreased to 21.0001% from 21.5973%.
- 6M: Fell to 21.0000% from 21.2899%.
- 12M: Dropped to 20.1001% from 20.4052%.
- PIB Auction Cutoff Yield (May 22, 2024 vs. April 16, 2024):
- 3Y: Slightly decreased to 16.6450% from 16.6500%.
- 5Y: Fell to 15.4500% from 15.4800%.
- 10Y: Dropped to 14.2999% from 14.3500%.
- 15Y, 20Y, 30Y: No bids received.
Weekly Indicators (May 24, 2024 – May 17, 2024)
- SBP FX Reserves: Decreased to $9,093.70 million from $9,157.00 million.
- Bank FX Reserves: Fell to $5,221.70 million from $5,428.40 million.
- Total FX Reserves: Declined to $14,315.40 million from $14,585.40 million.
- SPI (Combined Group): Slightly increased to 308.52 from 308.19.
- Change – WoW: Rose by 0.11%.
- Change – YOY: Increased by 21.40%.
Monthly Indicators (April vs. March)
- Consumer Price Index (Base 2015-16): Decreased to 263.32 from 264.46.
- Change – MOM: Dropped by -0.43%.
- Change – YOY: Rose by 17.34%.
- Wholesale Price Index (Base 2015-16): Fell to 315.74 from 317.95.
- Change – MOM: Increased by 0.70%.
- Change – YOY: Rose by 13.88%.
- Sensitive Price Indicator (Base 2015-16): Slightly decreased to 323.96 from 324.06.
- Change – MOM: Fell by -0.03%.
- Change – YOY: Rose by 28.77%.
- Exports: Decreased to $2,352.00 million from $2,567.00 million.
- Imports: Increased slightly to $4,865.00 million from $4,855.00 million.
- Trade Balance: Widened to -$2,513.00 million from -$2,288.00 million.
- Home Remittances: Decreased to $2,811.86 million from $2,953.98 million.
- Total Foreign Investment: Fell to -$604.71 million from $311.20 million.
- Current Account Balance: Improved to $491.00 million from $434.00 million.
- REER Index: Increased to 104.5122 from 104.0949.
- Change – MOM: Rose by 0.40%.
- Change – YOY: Increased by 22.15%.
- Large Scale Manufacturing Index: Decreased to 115.53 from 127.44.
- Change – MOM: Dropped by -9.35%.
- Change – YOY: Rose by 2.04%.
Quarterly Indicators (Mar 31, 2024 vs. Dec 31, 2023)
- Pakistan’s External Debt: Decreased to $130,401.70 million from $131,446.40 million.
- National Accounts – Growth Rates (Q3 – FY24 vs. Q2 – FY24):
- Agriculture: Fell to 3.94% from 5.83%.
- Industry: Rose to 3.84% from 0.09%.
- Services: Increased to 0.83% from 0.75%.
- Total: Improved to 2.09% from 1.79%.
Annual Indicators (FY23 vs. FY22)
- GDP Growth Rate: Dropped to -0.17% from 6.17%.
- Agriculture: Decreased to 2.25% from 4.28%.
- Manufacturing: Fell to -5.29% from 10.86%.
- Commodity Sector: Dropped to -0.50% from 5.49%.
- Services Sector: Decreased to 0.07% from 6.66%.
- Budget Deficit (As % of GDP): Improved slightly to -7.70% from -7.90%.
- Total Debt & Liabilities (As % of GDP): Increased to 91.10% from 89.70%.
- Total Debt & Liabilities (Rs. Billion): Rose to Rs. 77,104.10 billion from Rs. 59,772.10 billion.
- Trade Balance (July – June): Improved to -$27,547.00 million from -$48,354.00 million.
- Worker Remittances (July – June): Decreased to $27,027.63 million from $31,278.80 million.
- Foreign Investment (July – June): Fell to $429.67 million from $1,857.84 million.
- Current Account Balance (July – June): Improved to -$2,387.00 million from -$17,481.00 million.
- Annual Inflation Rate (July – June): Increased to 29.18% from 12.15%.


