The local bullion market witnessed a sharp decline in gold prices, with 24-karat gold plummeting by Rs3,500 to Rs210,800 per tola. This downturn is directly linked to the release of hotter-than-expected US inflation data, which has led to a recalibration of expectations regarding the Federal Reserve’s monetary policy.
In January 2024, the US Consumer Price Index (CPI) revealed a year-over-year increase of 3.1%, a figure that, while lower than December’s 3.4% YoY growth, exceeded market predictions of 2.9%. This deviation from expectations indicates a more stubborn inflationary environment than anticipated, challenging the optimism for imminent rate cuts by the Federal Reserve.
PERCENT CHANGES IN CPI FOR ALL URBAN CONSUMERS (CPI-U): U.S. CITY AVERAGE, JAN. 2024
| Category | Jul. 2023 | Aug. 2023 | Sep. 2023 | Oct. 2023 | Nov. 2023 | Dec. 2023 | Jan. 2024 | Unadjusted 12-mos. ended Jan. 2024 |
|---|---|---|---|---|---|---|---|---|
| All items | 0.2 | 0.5 | 0.4 | 0.1 | 0.2 | 0.2 | 0.3 | 3.1 |
| Food | 0.2 | 0.2 | 0.2 | 0.3 | 0.2 | 0.2 | 0.4 | 2.6 |
| Food at home | 0.2 | 0.2 | 0.1 | 0.3 | 0.0 | 0.1 | 0.4 | 1.2 |
| Food away from home | 0.2 | 0.3 | 0.4 | 0.4 | 0.4 | 0.3 | 0.5 | 5.1 |
| Energy | 0.0 | 4.4 | 1.2 | -2.1 | -1.6 | -0.2 | -0.9 | -4.6 |
| Energy commodities | -0.1 | 8.3 | 1.8 | -4.3 | -3.8 | -0.7 | -3.2 | -6.9 |
| Gasoline (all types) | -0.2 | 8.3 | 1.6 | -4.3 | -4.0 | -0.6 | -3.3 | -6.4 |
| Fuel oil | 2.1 | 11.2 | 6.4 | -6.4 | -1.1 | -3.3 | -4.5 | -14.2 |
| Energy services | 0.1 | 0.1 | 0.3 | 0.4 | 1.0 | 0.3 | 1.4 | -2.0 |
| Electricity | -0.4 | 0.2 | 0.8 | 0.4 | 1.0 | 0.6 | 1.2 | 3.8 |
| Utility (piped) gas service | 1.5 | -0.3 | -1.4 | 0.3 | 1.2 | -0.6 | 2.0 | -17.8 |
| All items less food and energy | 0.2 | 0.2 | 0.3 | 0.2 | 0.3 | 0.3 | 0.4 | 3.9 |
| Commodities less food and energy commodities | -0.3 | -0.2 | -0.2 | 0.0 | -0.2 | -0.1 | -0.3 | -0.3 |
| New vehicles | 0.0 | 0.2 | 0.2 | -0.1 | 0.0 | 0.2 | 0.0 | 0.7 |
| Used cars and trucks | -1.5 | -1.9 | -1.8 | -0.4 | 1.4 | 0.6 | -3.4 | -3.5 |
| Apparel | 0.1 | 0.2 | -0.3 | 0.0 | -0.6 | 0.0 | -0.7 | 0.1 |
| Medical care commodities | 0.5 | 0.6 | -0.3 | 0.4 | 0.5 | -0.1 | -0.6 | 3.0 |
| Services less energy services | 0.4 | 0.4 | 0.5 | 0.3 | 0.5 | 0.4 | 0.7 | 5.4 |
| Shelter | 0.5 | 0.3 | 0.6 | 0.3 | 0.4 | 0.4 | 0.6 | 6.0 |
| Transportation services | 0.8 | 1.6 | 0.7 | 0.9 | 1.0 | 0.1 | 1.0 | 9.5 |
| Medical care services | -0.3 | 0.0 | 0.2 | 0.2 | 0.5 | 0.5 | 0.7 | 0.6 |
IMPACT ON RATE EXPECTATIONS
The market’s reaction to the inflation report was swift, with a clear shift in expectations for the Federal Reserve’s rate decisions. Previously anticipated rate cuts in the early part of the year now seem less likely, with no chance seen for a reduction in March and only a 33% likelihood for May. However, a cut by June has been fully priced in by the market, reflecting a nuanced view of the Federal Reserve’s potential actions in response to the inflation data.
GLOBAL MARKET REACTIONS
Following the release of the inflation figures, the S&P 500 futures experienced a significant drop, declining by 1.1% and signaling a broader market apprehension about the pace of future rate cuts. This response underscores the influence of US monetary policy on global financial markets and investor sentiment.
THE SILVER LINING
Despite the current challenges, it’s worth noting that the Federal Reserve’s aggressive rate hikes and balance sheet reductions over the past year have made progress in curbing inflation, albeit still above the 2% goal. This delicate balance between controlling inflation and fostering economic growth remains a central theme in monetary policy discussions.
PRECIOUS METALS MARKET IN PAKISTAN
The ripple effects of the US inflation data extended to the precious metals market, with silver prices also witnessing a downturn. The price of 24-karat silver fell by Rs20 per tola, aligning with the broader trend of declining precious metal prices in response to stronger-than-expected inflation data and its implications for interest rates.
GLOBAL GOLD MARKET
On the international stage, gold prices retreated below the $2,000 mark for the first time in two months, illustrating the global impact of the US inflation data on gold’s appeal as a safe-haven asset. This adjustment reflects broader market recalibrations in anticipation of the Federal Reserve’s future monetary policy decisions.
In summary, the latest US inflation data has played a pivotal role in shaping market expectations, impacting gold and silver prices, and influencing global financial market dynamics. As investors and policymakers alike digest these figures, the interplay between inflation trends and monetary policy will continue to be a key focus in the financial world.
GOLD (XAUUSD) TECHNICAL ANALYSIS
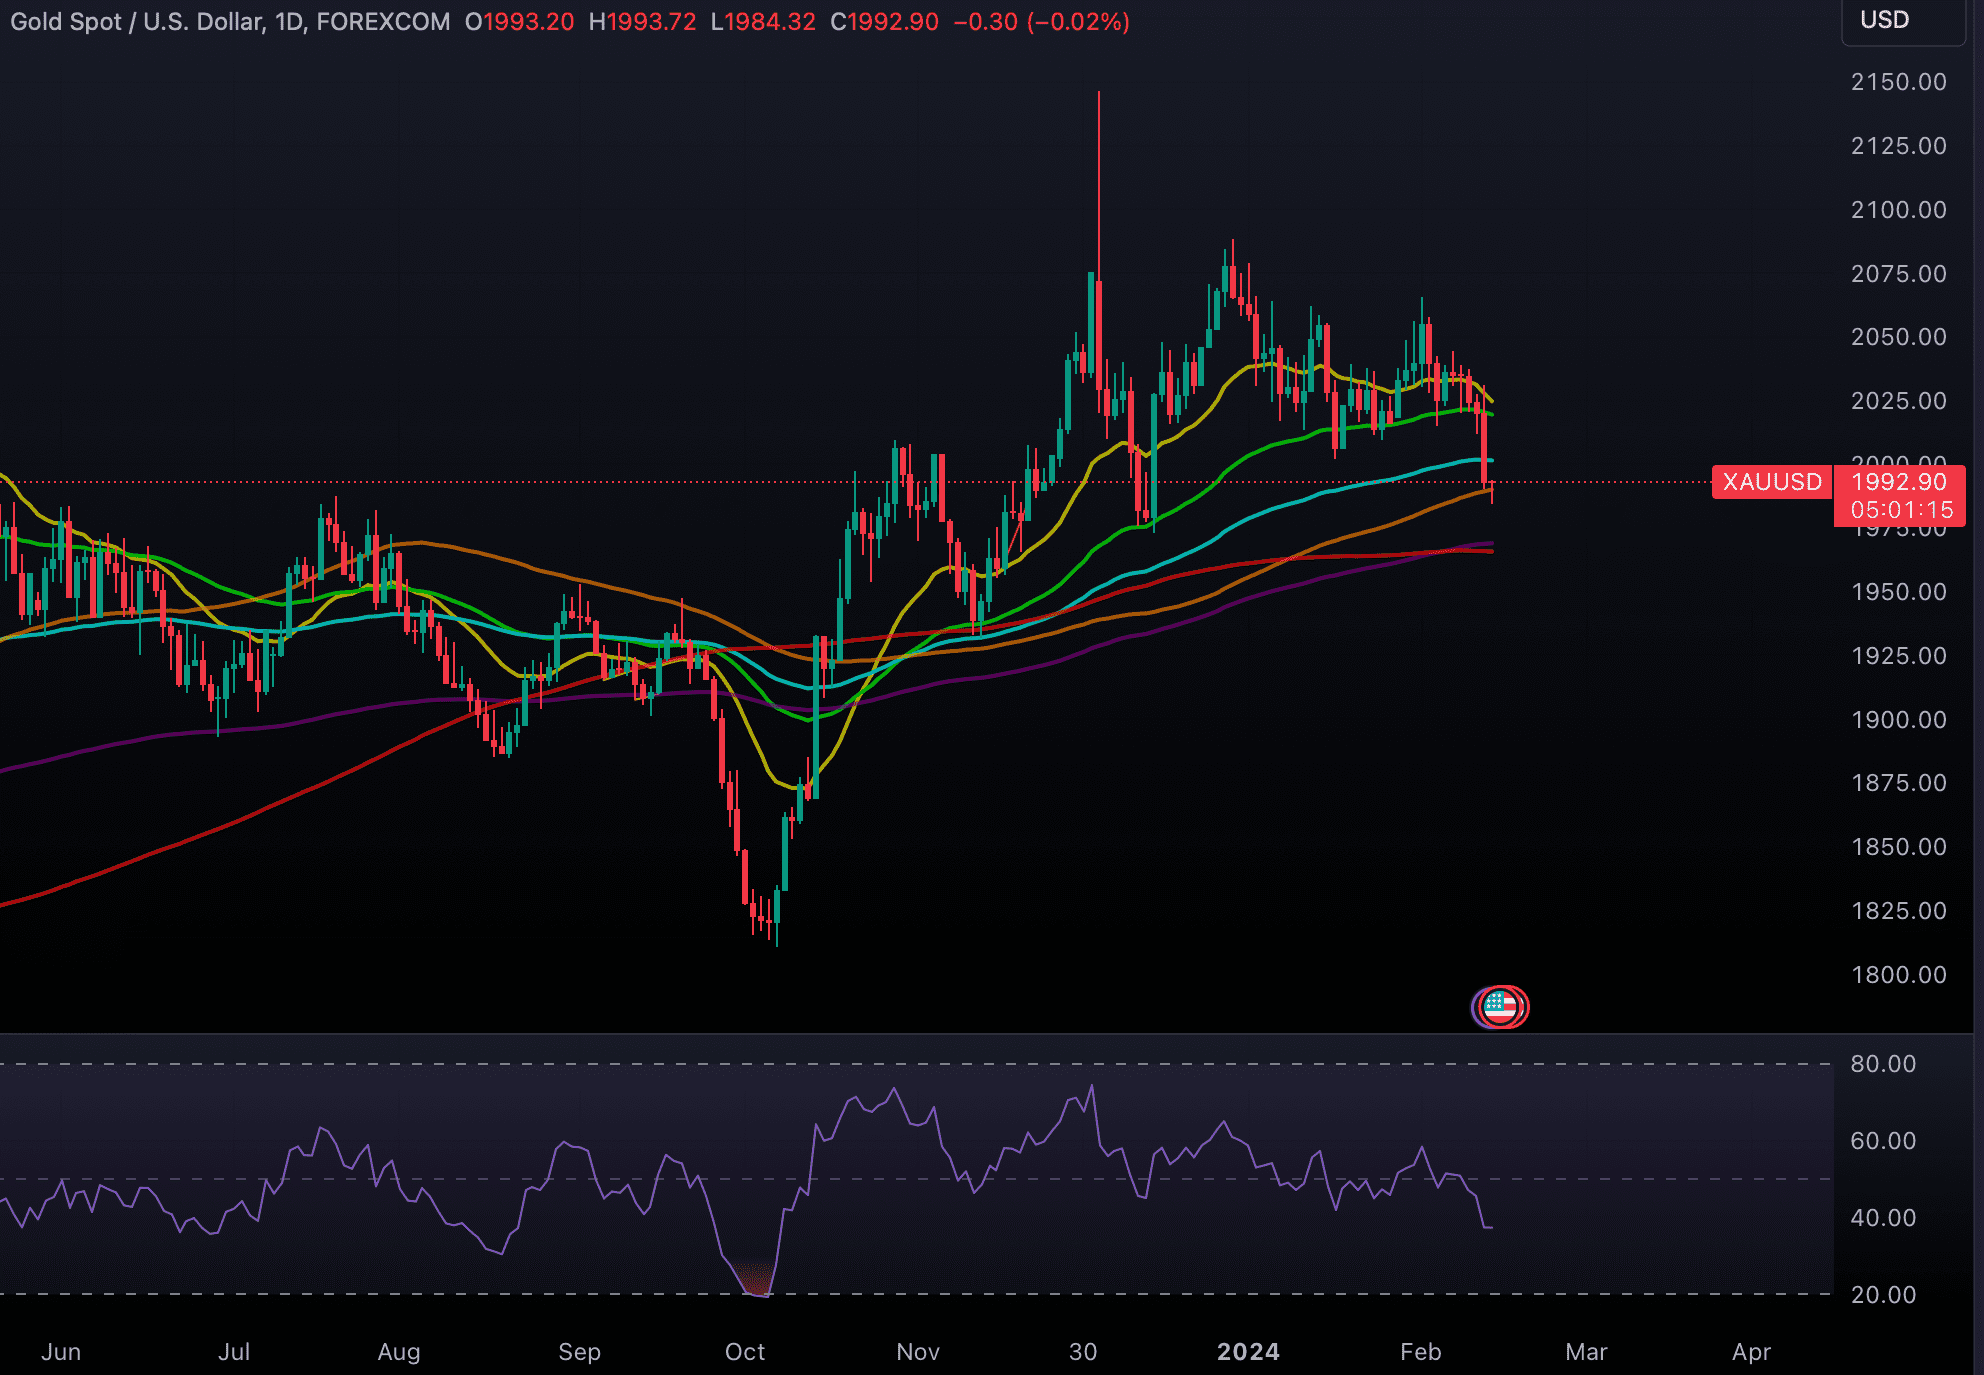
XAUUSD posted an intraday high of $1993.72 and intraday low of $1984.32. Gold is currently trading at $1992.90 (9:58pm Wednesday, 14 February 2024 (GMT+5) Time in Pakistan). A day earlier gold was trading at $2025.67 (2:31pm Tuesday, 12 February 2024 (GMT+5) Time in Pakistan).
Gold has recently experienced a significant downturn, breaking below the crucial $2,000 mark to register a new two-month low beneath $1,990. This decline marks a pivotal moment for the precious metal, as it navigates through intense market pressures and technical sell-off signals.
TECHNICAL BREAKDOWN SIGNALS FURTHER DECLINE
The precious metal’s journey below $2,000 was not just a breach of psychological support; it also indicated a more profound technical unraveling. The confirmation of a breakdown from a Symmetrical Triangle chart pattern, coupled with a broader bearish tick formation observed on Tuesday, underscores the mounting bearish sentiment surrounding gold. This pattern suggests that the market may brace for further declines in the near term.
EMA INDICATORS POINT TO BEARISH SHORT-TERM OUTLOOK
The short-term outlook for gold has turned increasingly bearish, as evidenced by the behavior of the 20 and 50-day Exponential Moving Averages (EMAs). Both EMAs are trending downwards, indicating that the momentum could continue to favor the bears in the short term. This development is crucial for traders and investors who rely on EMA indicators to gauge market sentiment and potential price movements.
FINDING SUPPORT NEAR THE 200-DAY EMA
Despite the current bearish momentum, there’s a silver lining for the gold market. The precious metal is expected to find some level of support near the 200-day EMA, which currently trades around $1,970. This key indicator could serve as a critical juncture, potentially offering a respite from the sell-off and possibly marking a turning point for gold prices.
RSI HIGHLIGHTS EXTENDED BEARISH MOMENTUM
The 14-period Relative Strength Index (RSI) further accentuates the bearish outlook, having dipped below 40.00 for the first time in over four months. The absence of oversold conditions or divergence signals within the RSI indicator suggests that the downward momentum for gold could persist, paving the way for additional losses.
In summary, there is a strong sell-off pressure and a bearish technical picture during this turbulent time for the gold market. Traders and investors will be closely monitoring it as it gets closer to critical support levels, looking for indications of stabilisation or possible reversals. But prudence is still advised, according to the existing signs, with a close watch on the technical thresholds that may determine the short-term course of gold.


