WEEKLY PERFORMANCE (AS OF JUNE 7, 2024)
- The PKR InterBank rate is 278.2000, slightly down from 278.3263 on May 31, 2024.
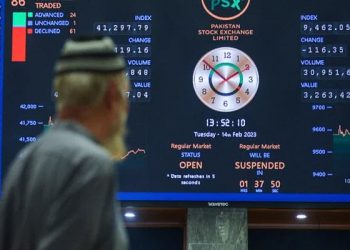
- The KSE100 Index stands at 73,754.02, a decline from 75,878.48.
- Average daily trading volume is 423,316,036 shares, down from 447,005,090.
- The price of gold in Karachi for 10 grams is Rs208,333, up from Rs207,219.
- The 6-month KIBOR is 20.70%, slightly down from 21.02%.
- The 10-year PIB yield remains almost unchanged at 14.13%.
- The Euro (EUR) exchange rate is 1.0806, down from 1.0848.
- The British Pound (GBP) is at 1.272, slightly down from 1.2742.
- The Swiss Franc (CHF) is 0.8965, down from 0.9024.
- The Japanese Yen (JPY) is 156.738, slightly down from 157.285.
- The Chinese Yuan (CNY) is 7.2461, slightly up from 7.242.
- Gold price is $2,293.71 per ounce, down from $2,327.82.
- Silver price is $29.172 per ounce, down from $30.408.
OPEN MARKET RATES (AS OF JUNE 7, 2024)
- The US Dollar (USD) is Rs280.00, slightly up from Rs279.49.
- The Euro (EUR) is Rs303.35, up from Rs301.33.
- The British Pound (GBP) is Rs356.09, up from Rs354.36.
- The Japanese Yen (JPY) is Rs1.79, up from Rs1.78.
- The UAE Dirham (AED) is Rs75.99, almost unchanged from Rs75.98.
- The Saudi Riyal (SAR) is Rs74.22, up from Rs74.20.
SBP DATA: T-BILL AUCTION CUTOFF YIELD
- The 3-month T-Bill yield is 21.0001% on May 29, 2024, down from 21.5973% on May 15, 2024.
- The 6-month T-Bill yield is 21.0000%, down from 21.2899%.
- The 12-month T-Bill yield is 20.1001%, down from 20.4052%.
PIB AUCTION CUTOFF YIELD
- The 3-year PIB yield is 16.6450% on May 22, 2024, almost unchanged from 16.6500% on April 16, 2024.
- The 5-year PIB yield is 15.4500%, slightly down from 15.4800%.
- The 10-year PIB yield is 14.2999%, down from 14.3500%.
- No bids were received for 15-year, 20-year, and 30-year PIBs.
INTEREST RATE CORRIDOR (AS OF JUNE 27, 2023)
- The SBP Policy Rate is 22.00%, up from 21.00% on April 5, 2023.
- The SBP Reverse Repo Rate is 23.00%, up from 22.00%.
- The SBP Repo Rate is 21.00%, up from 20.00%.
WEEKLY INDICATORS (AS OF MAY 31, 2024)
- SBP FX Reserves are $9,109.50 million, up from $9,093.70 million on May 24, 2024.
- Bank FX Reserves are $5,106.10 million, down from $5,221.70 million.
- Total FX Reserves are $14,215.60 million, down from $14,315.40 million.
SPI (AS OF JUNE 6, 2024)
- The Sensitive Price Indicator (SPI) for the combined group is 309.91, up from 308.52 on May 30, 2024.
- Week-on-week change is 0.45%, up from 0.11%.
- Year-on-year change is 21.69%, up from 21.40%.
MONTHLY INDICATORS
- The Consumer Price Index (CPI) for May is 254.78, down from 263.32 in April.
- Month-on-month change is -3.24%, down from -0.43%.
- Year-on-year change is 11.76%, down from 17.34%.
- The Wholesale Price Index (WPI) for May is 307.70, down from 315.74 in April.
- Month-on-month change is -2.55%, down from 0.70%.
- Year-on-year change is 9.93%, down from 13.88%.
- The Sensitive Price Indicator (SPI) for May is 310.91, down from 323.96 in April.
- Month-on-month change is -4.03%, down from -0.03%.
- Year-on-year change is 22.00%, down from 28.77%.
TRADE DATA
- Exports in May are $2,792.00 million, up from $2,351.00 million in April.
- Imports in May are $4,902.00 million, up from $4,846.00 million.
- The trade balance for May is -$2,110.00 million, down from -$2,495.00 million in April.
HOME REMITTANCES
- Home remittances in May are $3,242.90 million, up from $2,813.27 million in April.
FOREIGN INVESTMENT
- Total foreign investment in April is -$604.71 million, down from $311.20 million in March.
CURRENT ACCOUNT BALANCE
- The current account balance for April is $491.00 million, up from $434.00 million in March.
REER INDEX
- The REER Index for April is 104.5122, up from 104.0949 in March.
- Month-on-month change is 0.40%, down from 1.96%.
- Year-on-year change is 22.15%, up from 21.60%.
LARGE SCALE MANUFACTURING INDEX
- The Large Scale Manufacturing Index for March is 115.53, down from 127.44 in February.
- Month-on-month change is -9.35%, down from -3.08%.
- Year-on-year change is 2.04%, up from 1.19%.
QUARTERLY INDICATORS
- As of March 31, 2024, Pakistan’s external debt is $130,401.70 million, down from $131,446.40 million on December 31, 2023.
- National Accounts Growth Rates (Q3 FY24 vs. Q2 FY24):
- Agriculture: 3.94%, down from 5.83%.
- Industry: 3.84%, up from 0.09%.
- Services: 0.83%, up from 0.75%.
- Total: 2.09%, up from 1.79%.
ANNUAL INDICATORS
- GDP Growth Rate for FY23 is -0.17%, down from 6.17% in FY22.
- Agriculture growth for FY23 is 2.25%, down from 4.28% in FY22.
- Manufacturing growth for FY23 is -5.29%, down from 10.86% in FY22.
- Commodity sector growth for FY23 is -0.50%, down from 5.49% in FY22.
- Services sector growth for FY23 is 0.07%, down from 6.66% in FY22.
- Budget deficit as a percentage of GDP for FY23 is -7.70%, down from -7.90% in FY22.
- Total debt and liabilities as a percentage of GDP for FY23 are 91.10%, up from 89.70% in FY22.
- Total debt and liabilities in Rs billion for FY23 are 77,104.10, up from 59,772.10 in FY22.
- Trade balance for FY23 (July-June) is -$27,547.00 million, up from -$48,354.00 million in FY22.
- Worker remittances for FY23 (July-June) are $27,027.63 million, down from $31,278.80 million in FY22.
- Foreign investment for FY23 (July-June) is $429.67 million, down from $1,857.84 million in FY22.
- Current account balance for FY23 (July-June) is -$2,387.00 million, up from -$17,481.00 million in FY22.
- Annual inflation rate for FY23 (July-June) is 29.18%, up from 12.15% in FY22.


