Navigating the Waves Pakistan Stock Market: A Technical Analysis Summary of Pakistan Stock Market’s KSE-100 Index
Getting Ahead: A Technical Examination Synopsis of the KSE-100 Index of the Pakistani Stock Market
KSE100 WEEKLY RESEARCH REPORT

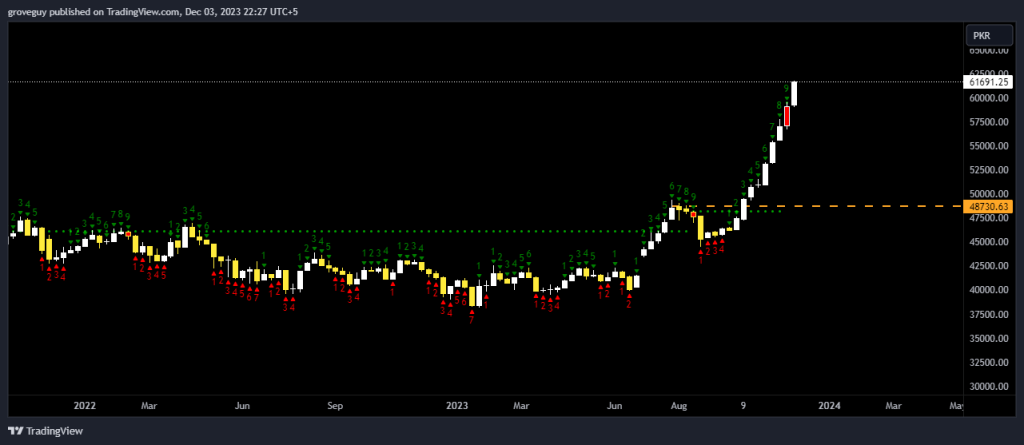
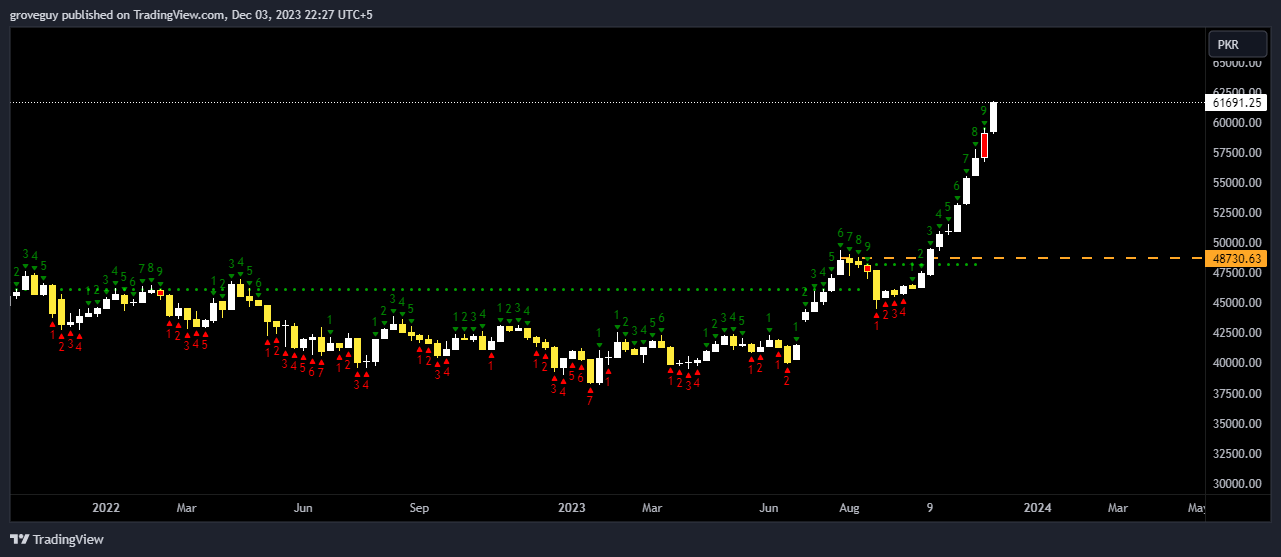
Weekly is far and away from the nearest sustainable support or structure, suggesting that there could be a pull back soon. Also sequential 9th weekly candle is indicating the same, nearest support on the weekly time frame is at 48730. To find more clues lets go to the smaller time frame.
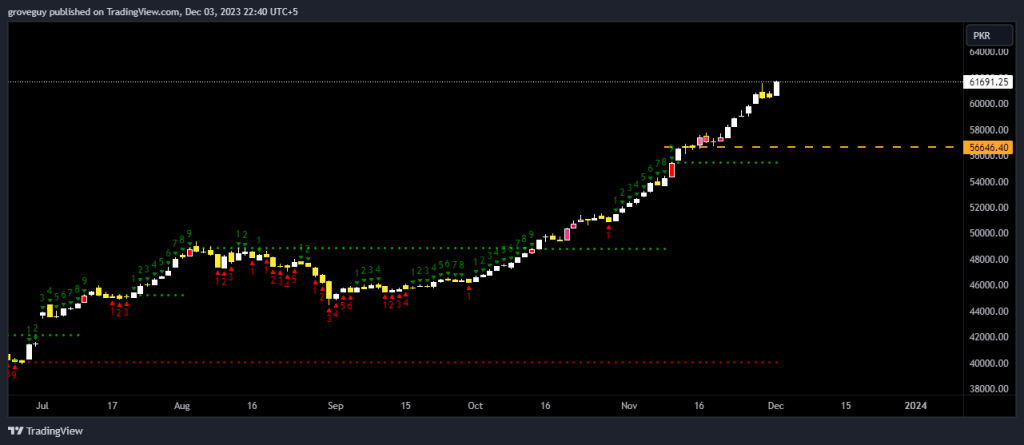
On the daily we can see a small structure near the 56646 level which is not a convincing support level, however we can refer to it as the nearest support. RSI on the daily time frame hasn’t shown any weakness yet.
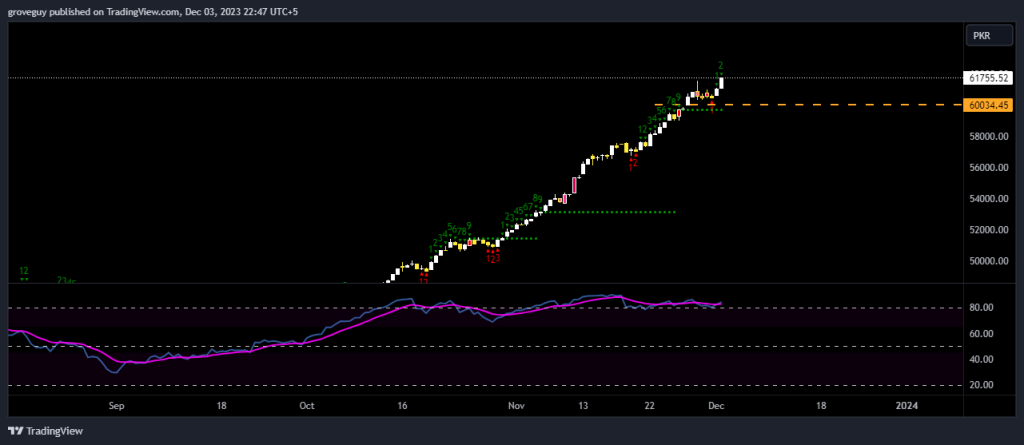
On the 4 hr time frame the RSI has started to show some weakness. The nearest support here is the 60000 level, indicating that a sustained move below 60000 level could lead to a further pull back IF and when it happens.