Our clear technical analysis will help you navigate the Pakistan Stock Market KSE-100 Index. Learn about the patterns, junctures, and critical signs in this volatile stock market to help you make wise decisions.

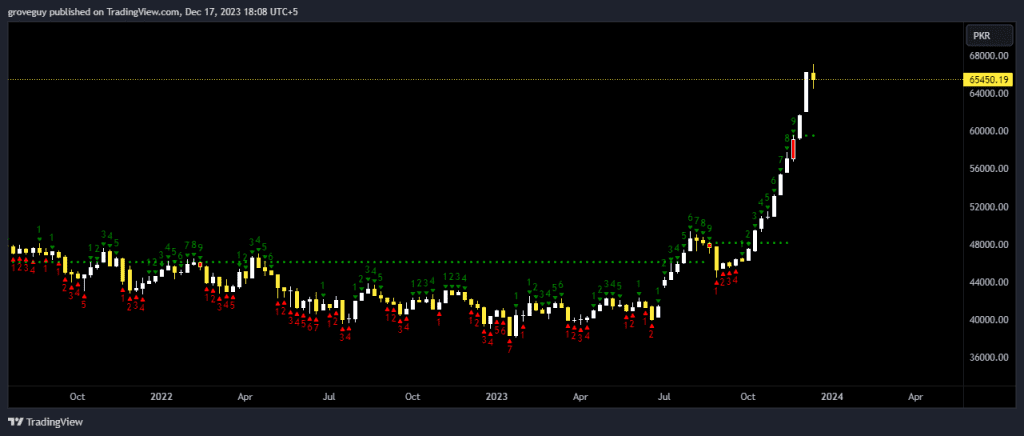
Its been 11 weeks that we have not seen a weekly candle close below the previous candle. Although it seems to be the case this week, indicating that we bight see some sort of consolidation or a pull back on the index.

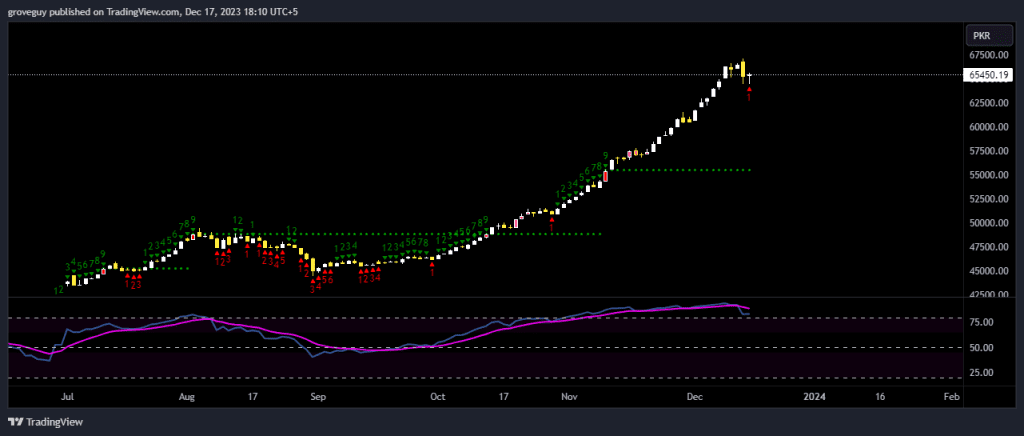
The daily is indicating the same that we might see some kind of consolidation or pull back. Although the support on daily seems to be around 55500 level.

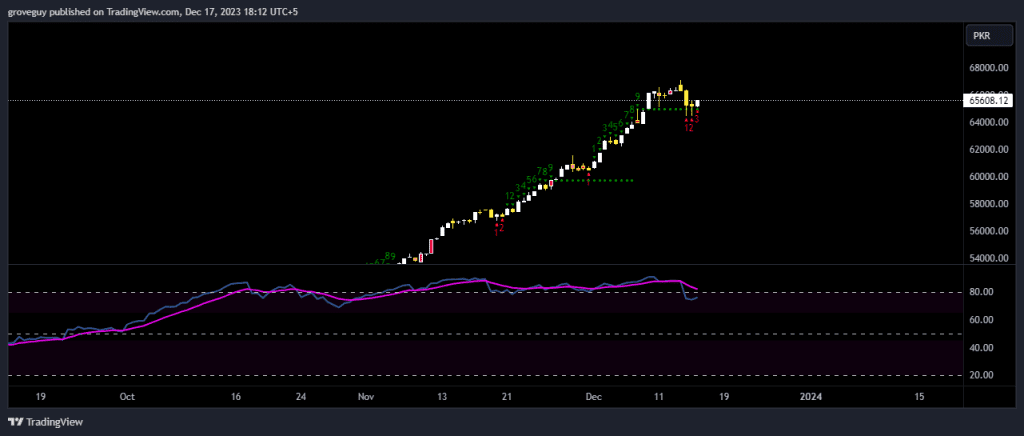
The 4hr time frame is indicating a divergence formation which might push up a bit of the price action up-to the recent top that we just made.


