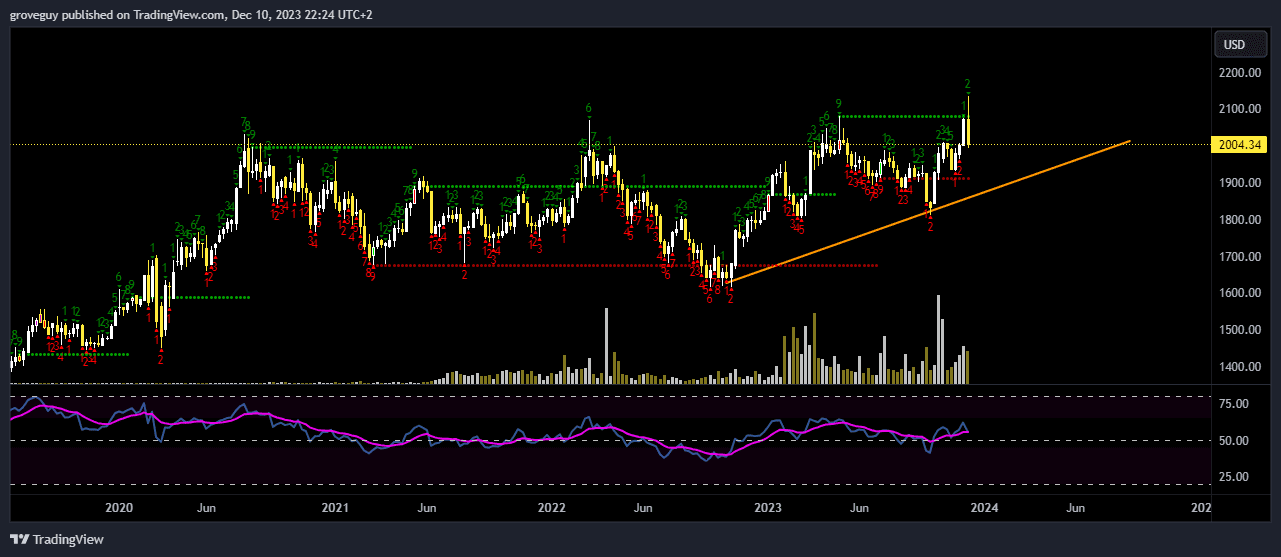
As we mentioned previously for Gold that it needs to close above 2081.82 on a weekly time frame which then could become a huge break out for Gold, but it couldn’t meaning, that it needs a bit more time.
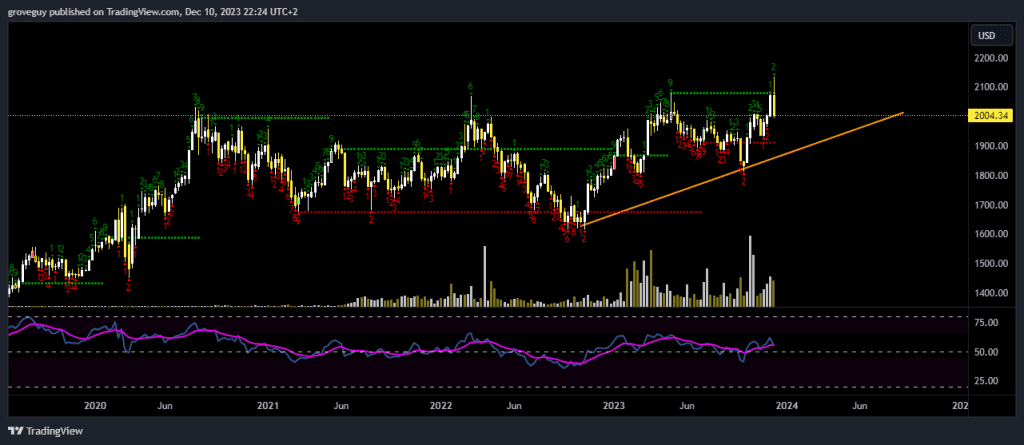 Could be anywhere between 1 to 4 weeks of consolidation/pullback. However for a safe and healthy pul back refer to the trend line in the given weekly chart. Any pull back that sustains above the support would be considered healthy consolidation.
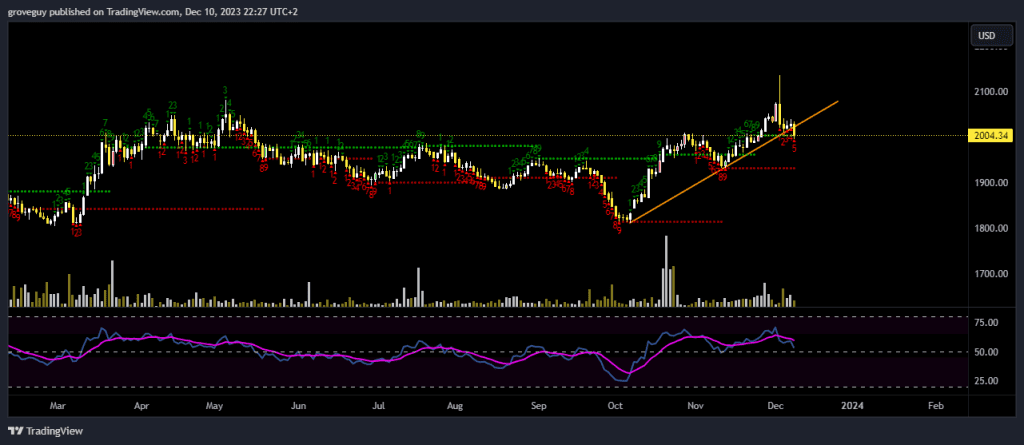
Here on the daily time frame we can see that we broken below the rising trend line. The next support in line is at 1934 level. If a daily close happens below that level then refer to the weekly support.
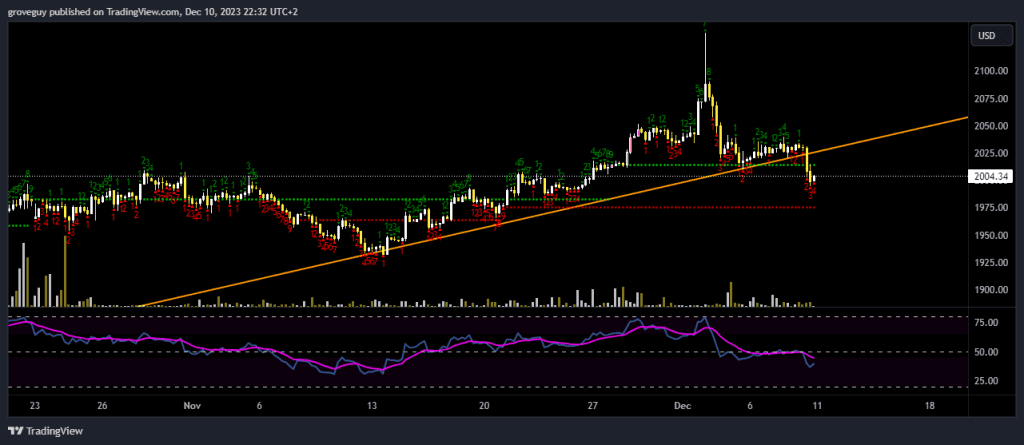
Here on the 4hr time frame we can expect a bounce off the 1976 level up-to the trend line that was broken, as can be seen in the chart OR a retest of the trend line can happen first and then a rejection from it could lead to the further downwards pressure. This could place a reset on the smaller term time frames where Oscillators are over bought and could result in cool off metric for the larger term time frame.