


How to invest in Pakistan stock market: The principal prerequisite for commencing this voyage is a small amount of PKR 5,000, which functions as the opening deposit to create your account with the Pakistan Stock Exchange (PSX). The Securities and Exchange Commission of Pakistan (SECP) requires you to work with a licenced broker in order to begin the process of opening an account on the Pakistan Stock Market (PSX).
LEARN TO SAFELY INVEST IN PAKISTAN & TAKE CHARGE OF YOUR OWN MONEY
Once you have the required login credentials, only then can you make this deposit. You can purchase shares from businesses that are listed on the Pakistan Stock Exchange with ease thanks to this account’s compatibility with mobile devices, which adds even more convenience.
Discover the Benefits of Personalized Coaching!
Ready to transform your life? Book a session today to get started at minimal prices! Click now and take the first step towards achieving your goals. Don’t miss out on this opportunity for personalized coaching designed just for you!
SPOT AND FUTURES TRADING
In the context of Pakistan Stock Market and all the financial markets, it’s crucial to understand the fundamental distinctions between SPOT and FUTURES transactions.
In SPOT transactions, you directly possess the underlying asset. For instance, if a share is priced at Rs10 per share and you acquire it by paying the full price, you become the owner of the asset. It’s a straightforward ownership arrangement.
One interesting yet highly risky feature of the Pakistan Stock Exchange (PSX) is that you can trade futures contracts worth Rs300,000 with just Rs100,000. It’s crucial to understand that you do not own the underlying asset because the remaining Rs 200,000 does not belong to you. Leverage has the ability to magnify possible gains as well as losses. Owing to the significant risk involved, seasoned professionals with a great deal of experience managing high-risk assets tend to favour futures trading on the PSX.
HOW TO TRADE FUTURE CONTRACTS IN PSX
When you intend to purchase a futures contract for a specific stock, like PRL, and you’re targeting the contract for the month of February (PRL-FEB), you can initiate this process by simply entering the contract symbol (PRL-FEB) on your trading terminals. This will enable you to access real-time price quotes for that particular futures contract.
Crucially, it’s imperative to note that these futures contracts come with a predefined expiration date. In the case of the February contract (PRL-FEB), you must close this position by the last Friday of February.
As the last week of the contract’s validity approaches, typically known as the “roll-over week,” new futures contracts for the following month become available. In this instance, you can begin trading the next contract, which would be (PRL-MAR), representing the March contract.
It’s important to be aware that during the roll-over week, when contracts transition from one month to the next, you may experience increased market volatility. This heightened volatility often occurs due to the simultaneous closing of expiring contracts and the opening of new ones, which can impact trading dynamics and prices. Traders should exercise caution and employ appropriate risk management strategies during this period.
HOW TO SHORT SELL IN PSX
Short selling involves selling an asset at a higher price with the expectation that its price will decline, and then repurchasing it when the price has indeed fallen. The difference between the selling price and the repurchase price constitutes your profit or loss.
Let’s go through your example for further clarity:
- The price of PRL-FEB is initially at RS25, and you believe it might decrease. You decide to short sell 1000 shares of PRL at RS25, using a total amount of RS25,000 from your account.
- If the share price subsequently drops to RS20, you decide to buy back the 1000 shares at this lower price to close your short position. You’ve sold at RS25 and repurchased at RS20, resulting in a profit of RS5 per share.
- Your total profit in this case is RS5 per share multiplied by 1000 shares, which equals RS5,000.
However, if the trade goes against your prediction, and the share price increases, say to RS27, and you decide to limit your losses by buying back the shares at that higher price, you will incur a loss.
In this scenario, the difference between your selling price of RS25 and your repurchase price of RS27 results in a loss of RS2 per share. With 1000 shares, your total loss would be RS2,000.
So, in short selling, your profit or loss depends on the price movement of the asset. If it goes down, you make a profit, and if it goes up, you incur a loss. It’s indeed a straightforward concept but comes with a certain level of risk, especially if the asset’s price moves against your expectations.
SPOT AND FUTURE MARKETS
Spot Market:
The spot market, often referred to as the “cash market,” is where financial assets, like stocks, commodities, or currencies, are bought and sold for immediate delivery and payment. Here’s how it works:
- Immediate Transactions: In the spot market, when you buy or sell an asset, the transaction occurs instantly. You pay for the asset, and you receive ownership of it right away. For example, if you want to buy a share of a company’s stock, you pay the current market price, and you own the stock immediately.
- Physical Delivery: In some cases, the spot market involves the actual physical exchange of the asset. For instance, if you buy a bushel of wheat in the spot market, you may receive the physical wheat delivered to you.
- Market Prices: Prices in the spot market are determined by the supply and demand at that moment. They can fluctuate throughout the trading day as buyers and sellers interact.
Futures Market:
The futures market, on the other hand, deals with contracts for the future delivery of assets. It’s a bit more complex but can be understood with these key points:
- Future Contracts: Unlike the spot market, where you buy or sell the actual asset, the futures market does not involve this. Instead, you buy or sell the asset under contracts that require you to do so at a specific price at a later time.
- Speculation and Hedging: Hedging and speculation are the two primary uses of futures contracts. By purchasing low and selling high, or vice versa, speculators seek to profit from price movements. Hedgers use futures contracts, just like farmers or businesses do, to hedge against price swings. To guarantee a consistent income, a farmer could, for instance, use a corn futures contract to lock in the price for their corn crop.
Leverage: One notable aspect of the futures market is leverage. You only need to deposit a fraction of the contract’s value as margin, making it possible to control a much larger position. While this can amplify profits, it also increases the potential for losses.
Settlement: Futures contracts have an expiration date when they must be settled. Settlement can be either physical (where the actual asset is exchanged) or cash (where the difference between the contract price and the market price is settled in cash). Most traders in the futures market close their positions before the expiration date to avoid physical delivery.
In summary: spot trading involves the instantaneous exchange of assets, whereas futures trading deals with contracts for future delivery. Spot market transactions are less complicated and involve simpler agreements than those in the futures market, which can be used for both risk management and speculation.
CHART PATTERNS & CHART PATTERNS TO KNOW
Chart patterns, also known as “simple shapes or structures” in the world of technical analysis, play a vital role in predicting future price movements based on historical market behavior. Traders must have a solid understanding of these patterns and what they signify when employing technical analysis.
There’s no one-size-fits-all chart pattern because they are employed to highlight various trends in diverse markets. Chart patterns are often used in conjunction with candlestick trading, which offers a clear view of previous opening and closing prices.
Certain patterns are better suited for volatile markets, while others are more appropriate for less volatile ones. Some are particularly effective in bullish market conditions, while others shine in bearish environments.
It’s crucial to identify the most suitable chart pattern for your specific market, as selecting the wrong one or not knowing which to use could result in missed opportunities for profit.
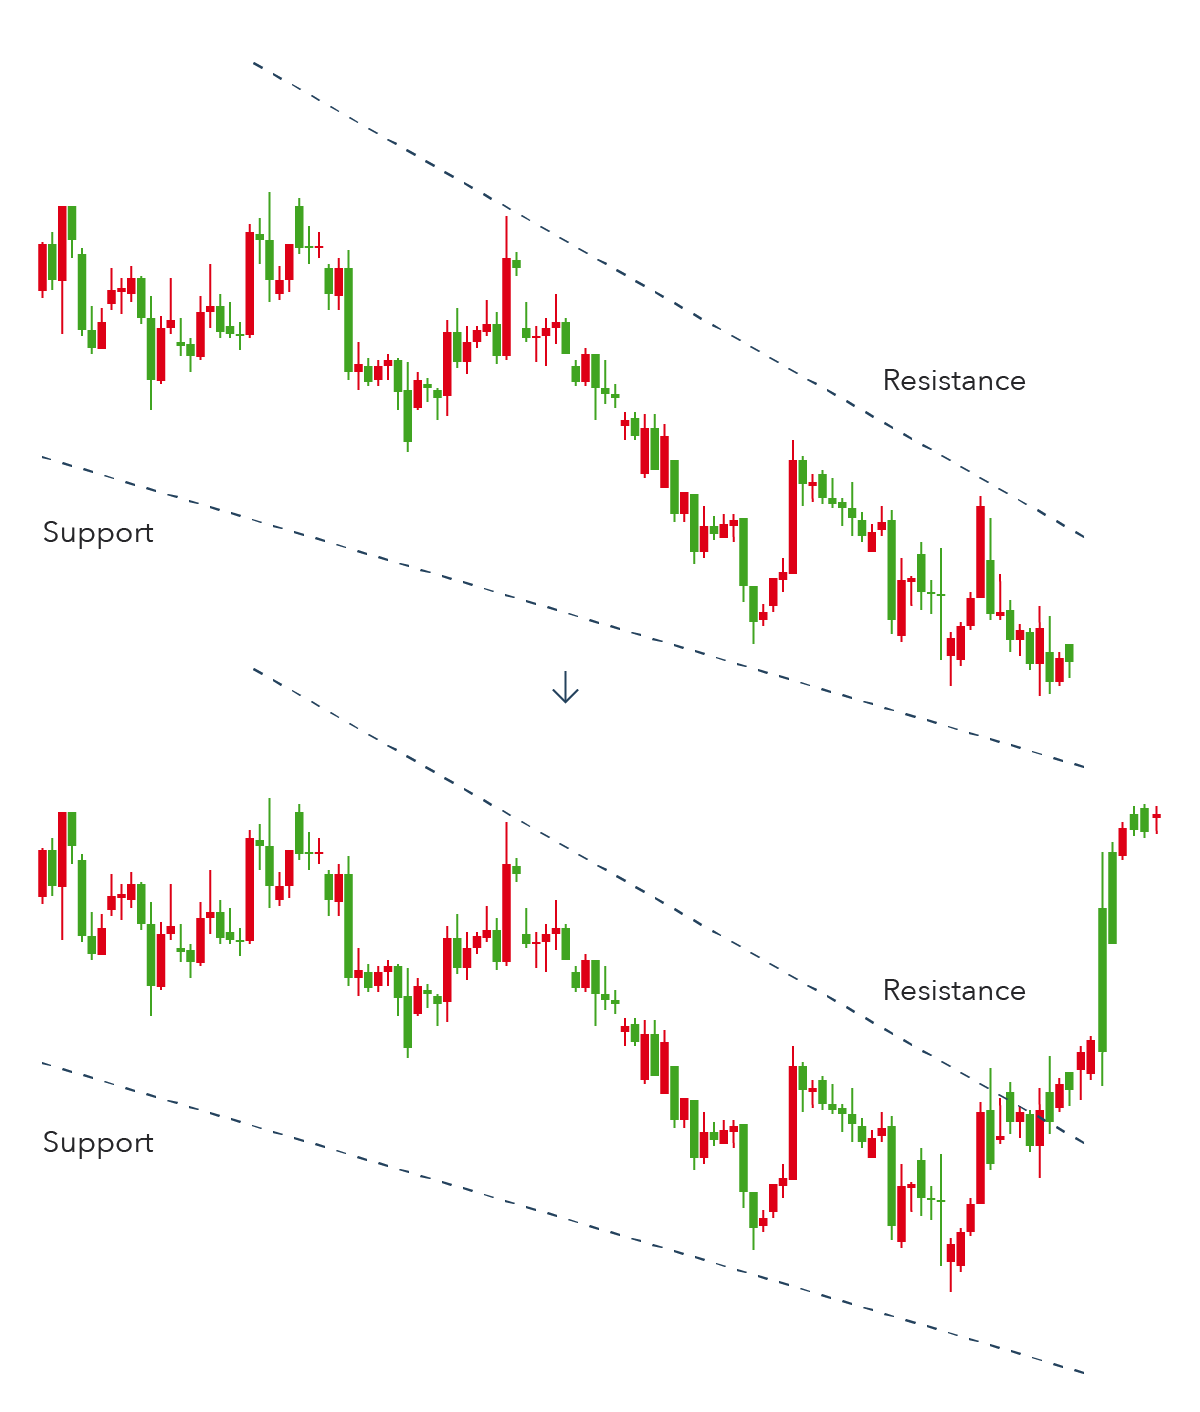
Before delving into the intricacies of various chart patterns, it’s important to understand the concept of support and resistance levels. Support denotes the level at which an asset’s price ceases its descent and rebounds upward, while resistance is where the price tends to halt its ascent and starts declining.
Support and resistance levels arise due to the balance between buyers and sellers, or in terms of supply and demand. When there’s a surplus of buyers relative to sellers (greater demand than supply), prices generally rise. Conversely, when there are more sellers than buyers (greater supply than demand), prices tend to fall.
Consider this example: an asset’s price is on the rise because demand exceeds supply. However, the price will eventually reach a point at which buyers are unwilling to pay more, leading to a decrease in demand. At this juncture, some buyers may opt to close their positions.
This creates a level of resistance, and the price begins to recede toward a support level as supply surpasses demand, prompting more buyers to close their positions. As the price decreases sufficiently, it becomes more attractive to buyers again, resulting in a support level where supply and demand find a balance.
If the heightened buying interest persists, it can propel the price back up toward a resistance level as demand starts to surpass supply. Once a price breaches a resistance level, it can potentially transform into a support level in the future. These support and resistance dynamics are fundamental elements in understanding price movements in technical analysis.
CHART PATTERNS ARE A VALUABLE TOOL IN TECHNICAL ANALYSIS AND CAN BE BROADLY CATEGORIZED INTO THREE MAIN TYPES: CONTINUATION PATTERNS, REVERSAL PATTERNS, AND BILATERAL PATTERNS.
1. Continuation Patterns: These patterns indicate that the existing market trend is likely to persist. They suggest a temporary pause in the trend before it resumes its previous direction. Traders who identify continuation patterns may anticipate that the ongoing trend will continue and position themselves accordingly.
2. Reversal Patterns: Reversal patterns, on the other hand, signal a potential change in the current trend’s direction. These patterns suggest that the prevailing trend may be losing strength and that a reversal may be imminent. Traders who spot reversal patterns might prepare for a shift in the market’s direction and adjust their positions accordingly.
3. Bilateral Patterns:Bilateral patterns are unique in that they don’t strongly indicate whether the market will move up or down. These patterns suggest that the price could move in either direction, reflecting a high level of market volatility and uncertainty. Traders who encounter bilateral patterns need to exercise caution and consider a range of factors before making a trading decision.
Incorporating these patterns into your technical analysis is a common practice. In the Pakistan Stock Market, as in other financial markets, chart patterns can be used in conjunction with various trading instruments, including Contracts for Difference (CFDs). CFDs provide traders with the flexibility to take both long and short positions, meaning they can speculate on market movements in either direction. Whether to go long (buy) or short (sell) depends on the specific pattern and the results of thorough market analysis.
It’s essential to understand that while chart patterns provide valuable insights into potential market movements, they are not guarantees. They serve as indications of what may happen to an asset’s price based on historical behavior and pattern recognition. Traders should use these patterns in conjunction with other analysis techniques and risk management strategies to make well-informed trading decisions.
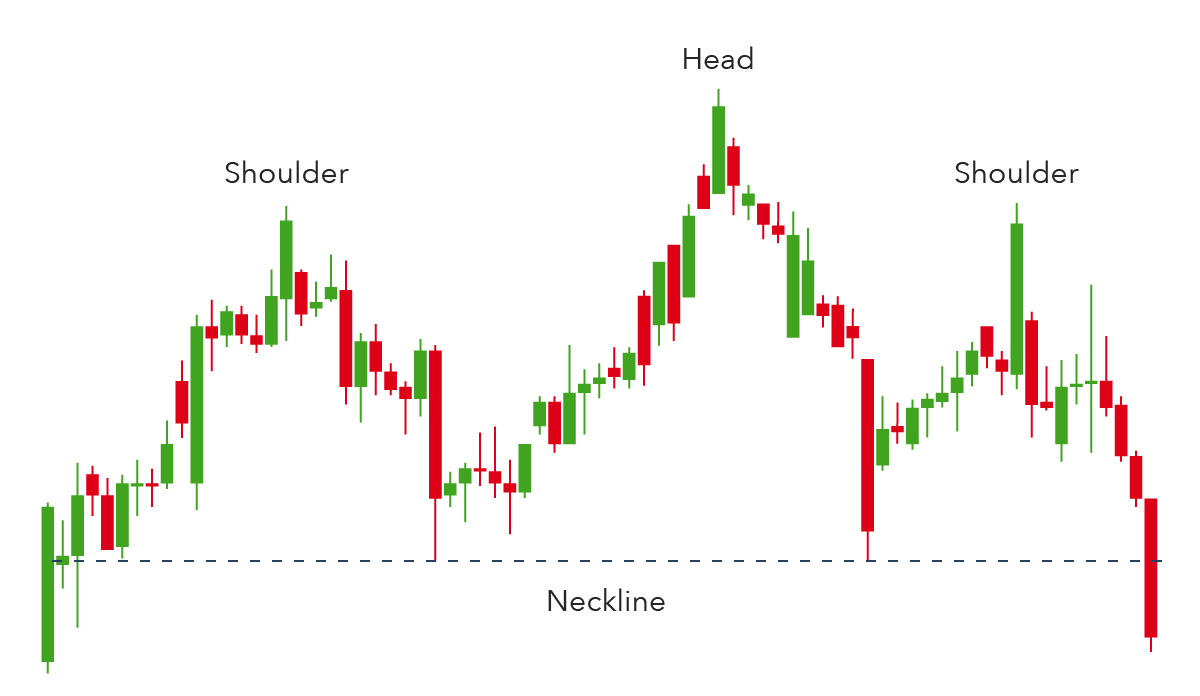
HEAD AND SHOULDERS
Head and shoulders is a chart pattern in which a large peak has a slightly smaller peak on either side of it. Traders look at head and shoulders patterns to predict a bullish-to-bearish reversal.
Typically, the first and third peak will be smaller than the second, but they will all fall back to the same level of support, otherwise known as the ‘neckline’. Once the third peak has fallen back to the level of support, it is likely that it will breakout into a bearish downtrend.
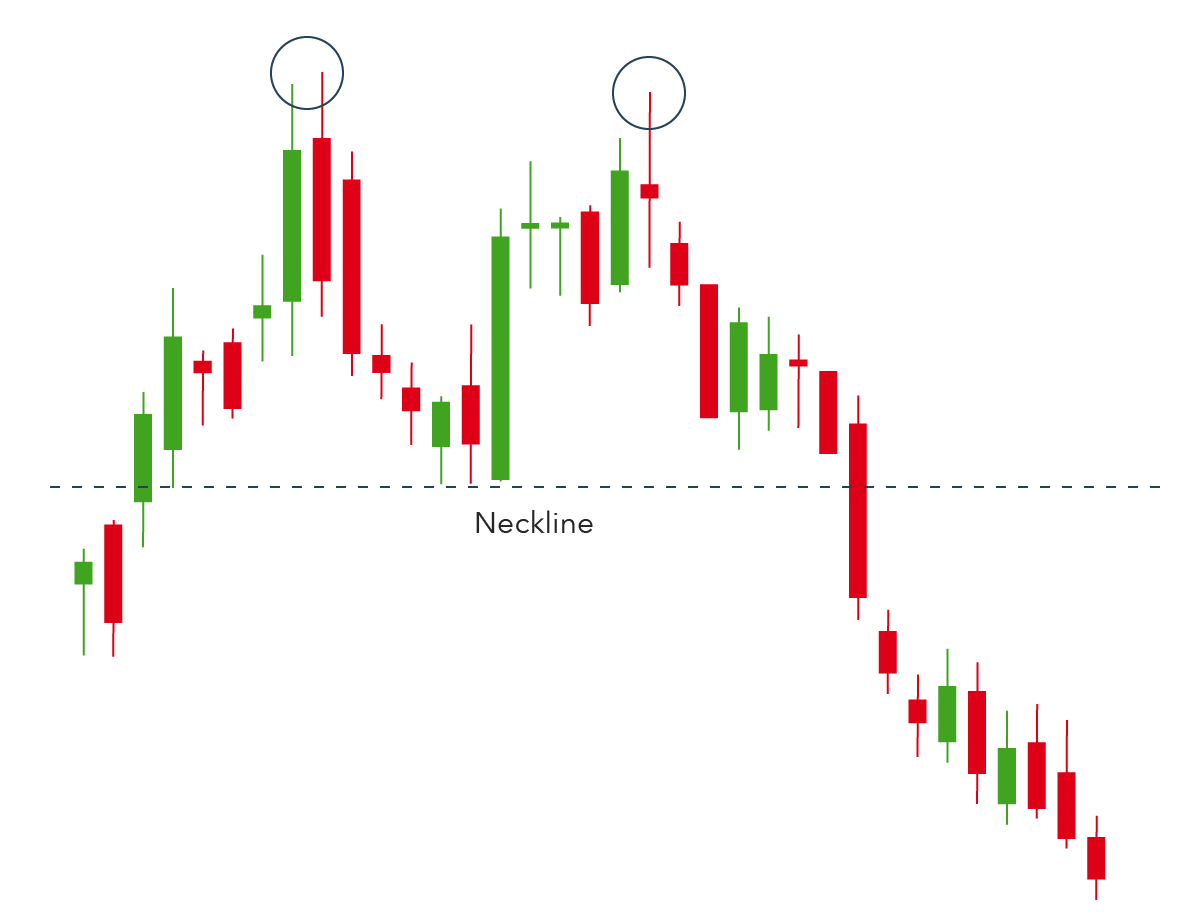
DOUBLE TOP
A double top is another pattern that traders use to highlight trend reversals. Typically, an asset’s price will experience a peak, before retracing back to a level of support. It will then climb up once more before reversing back more permanently against the prevailing trend.
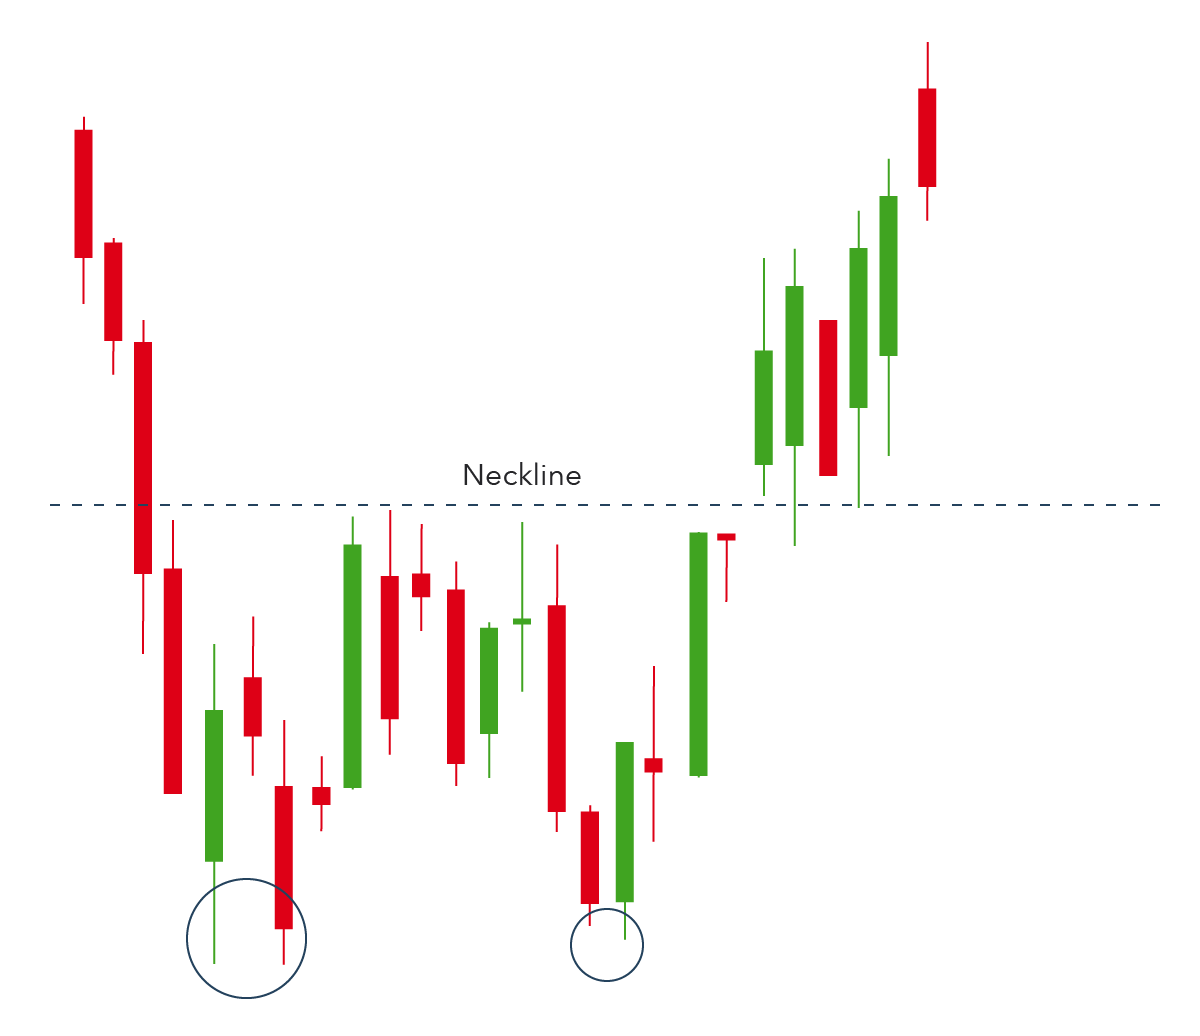
DOUBLE BOTTON
A double bottom chart pattern indicates a period of selling, causing an asset’s price to drop below a level of support. It will then rise to a level of resistance, before dropping again. Finally, the trend will reverse and begin an upward motion as the market becomes more bullish.
A double bottom is a bullish reversal pattern, because it signifies the end of a downtrend and a shift towards an uptrend.
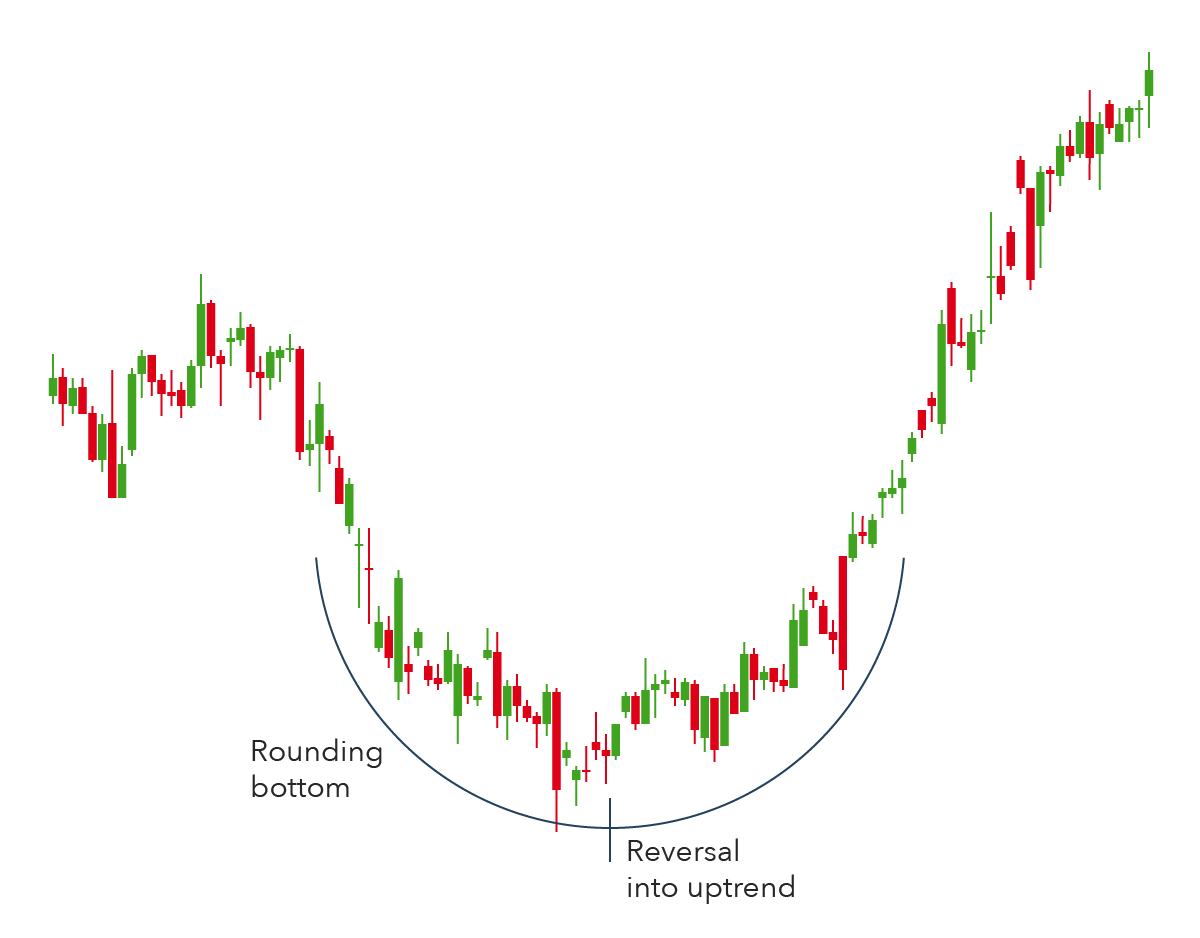
ROUND BOTTOM
A rounding bottom chart pattern can signify a continuation or a reversal. For instance, during an uptrend an asset’s price may fall back slightly before rising once more. This would be a bullish continuation.
An example of a bullish reversal rounding bottom – shown below – would be if an asset’s price was in a downward trend and a rounding bottom formed before the trend reversed and entered a bullish uptrend.
Traders will seek to capitalise on this pattern by buying halfway around the bottom, at the low point, and capitalising on the continuation once it breaks above a level of resistance.
CUP AND HANDLE
The cup and handle pattern is a bullish continuation pattern that is used to show a period of bearish market sentiment before the overall trend finally continues in a bullish motion. The cup appears similar to a rounding bottom chart pattern, and the handle is similar to a wedge pattern – which is explained in the next section.
Following the rounding bottom, the price of an asset will likely enter a temporary retracement, which is known as the handle because this retracement is confined to two parallel lines on the price graph. The asset will eventually reverse out of the handle and continue with the overall bullish trend.

WEDGES
Wedges form as an asset’s price movements tighten between two sloping trend lines. There are two types of wedge: rising and falling.
A rising wedge is represented by a trend line caught between two upwardly slanted lines of support and resistance. In this case the line of support is steeper than the resistance line. This pattern generally signals that an asset’s price will eventually decline more permanently – which is demonstrated when it breaks through the support level.

A falling wedge occurs between two downwardly sloping levels. In this case the line of resistance is steeper than the support. A falling wedge is usually indicative that an asset’s price will rise and break through the level of resistance, as shown in the example below.
Both rising and falling wedges are reversal patterns, with rising wedges representing a bearish market and falling wedges being more typical of a bullish market.
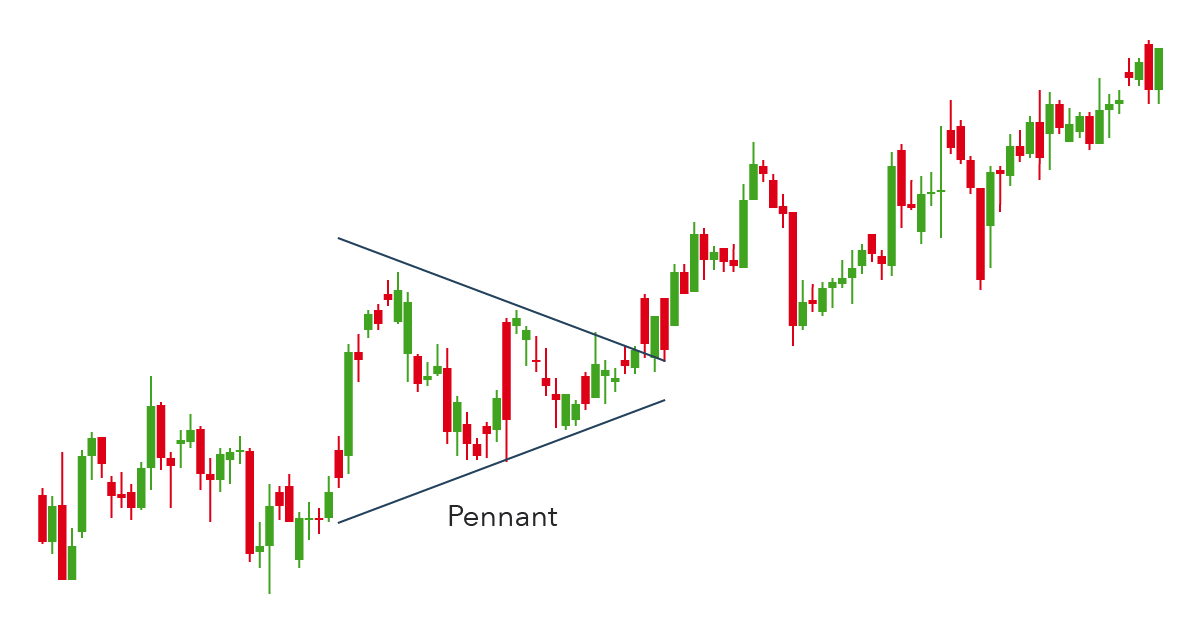
FLAGS OR PENNANT
Flags patterns, or pennant, are created after an asset experiences a period of upward movement, followed by a consolidation. Generally, there will be a significant increase during the early stages of the trend, before it enters into a series of smaller upward and downward movements.
Pennants can be either bullish or bearish, and they can represent a continuation or a reversal. The above chart is an example of a bullish continuation. In this respect, pennants can be a form of bilateral pattern because they show either continuations or reversals.
While a pennant may seem similar to a wedge pattern or a triangle pattern – explained in the next sections – it is important to note that wedges are narrower than pennants or triangles. Also, wedges differ from pennants because a wedge is always ascending or descending, while a pennant is always horizontal.
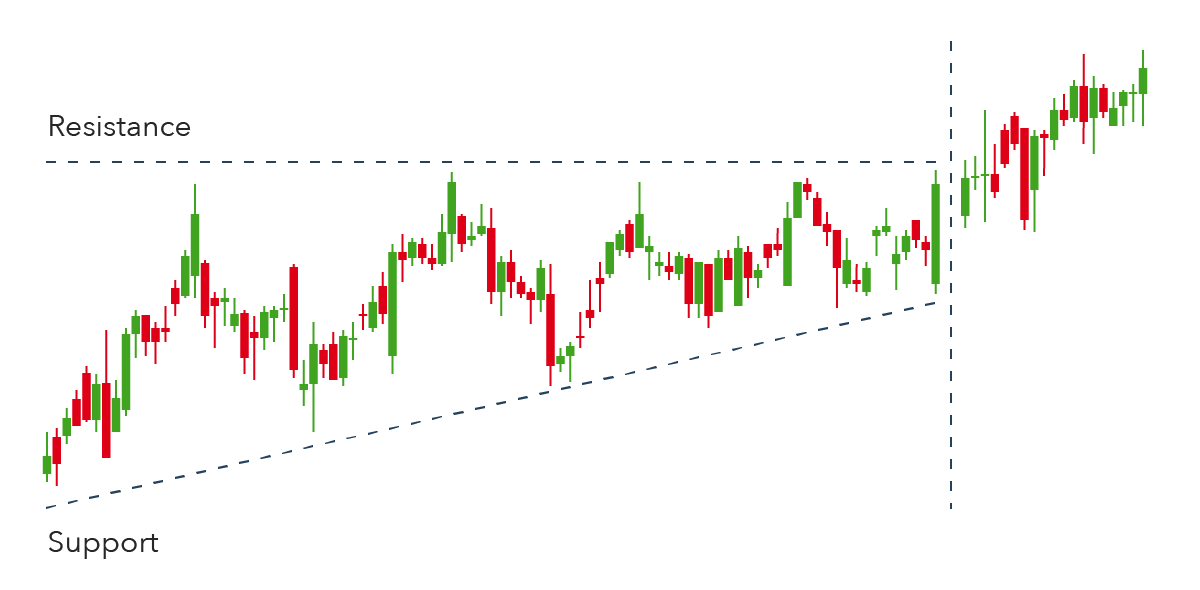
ASCENDING TRIANGLE
The ascending triangle is a bullish continuation pattern which signifies the continuation of an uptrend. Ascending triangles can be drawn onto charts by placing a horizontal line along the swing highs – the resistance – and then drawing an ascending trend line along the swing lows – the support.
Ascending triangles often have two or more identical peak highs which allow for the horizontal line to be drawn. The trend line signifies the overall uptrend of the pattern, while the horizontal line indicates the historic level of resistance for that particular asset.
DESCENDING TRIANGLE
In contrast, a descending triangle signifies a bearish continuation of a downtrend. Typically, a trader will enter a short position during a descending triangle – possibly with CFDs – in an attempt to profit from a falling market.
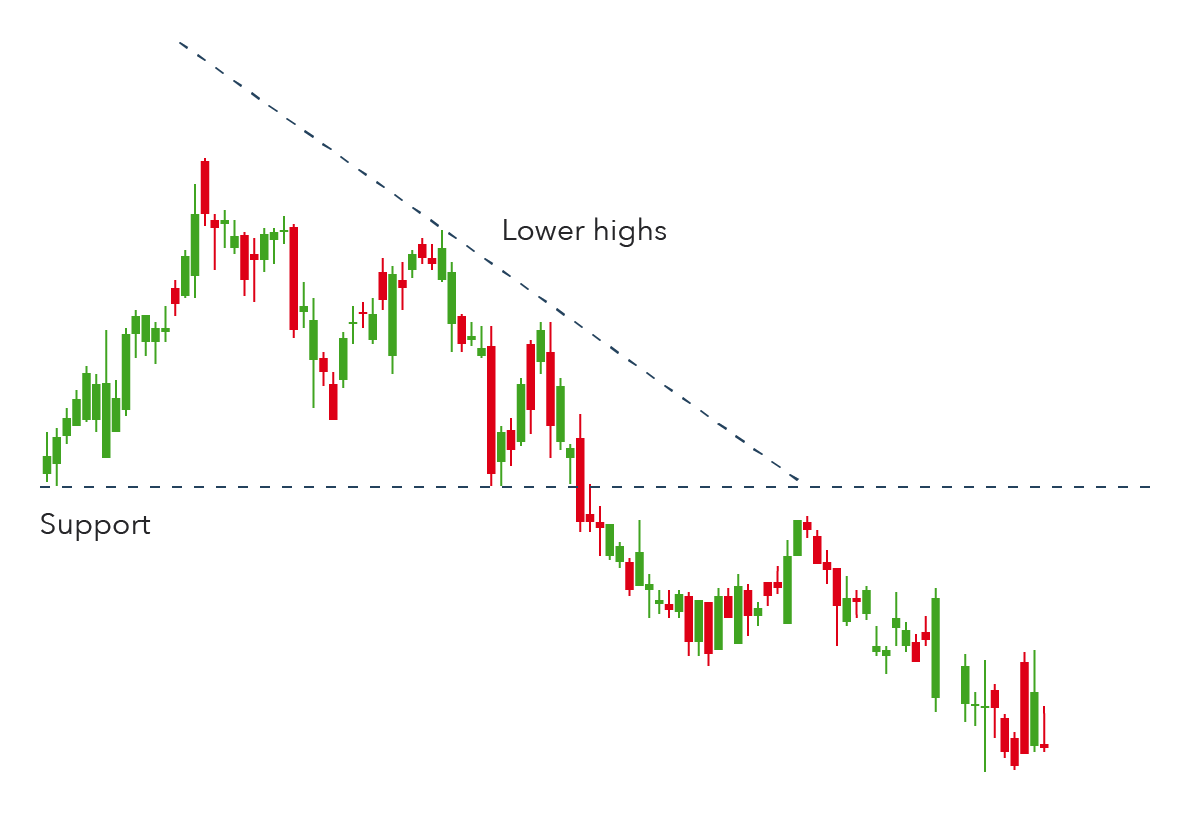
Descending triangles generally shift lower and break through the support because they are indicative of a market dominated by sellers, meaning that successively lower peaks are likely to be prevalent and unlikely to reverse.
Descending triangles can be identified from a horizontal line of support and a downward-sloping line of resistance. Eventually, the trend will break through the support and the downtrend will continue.
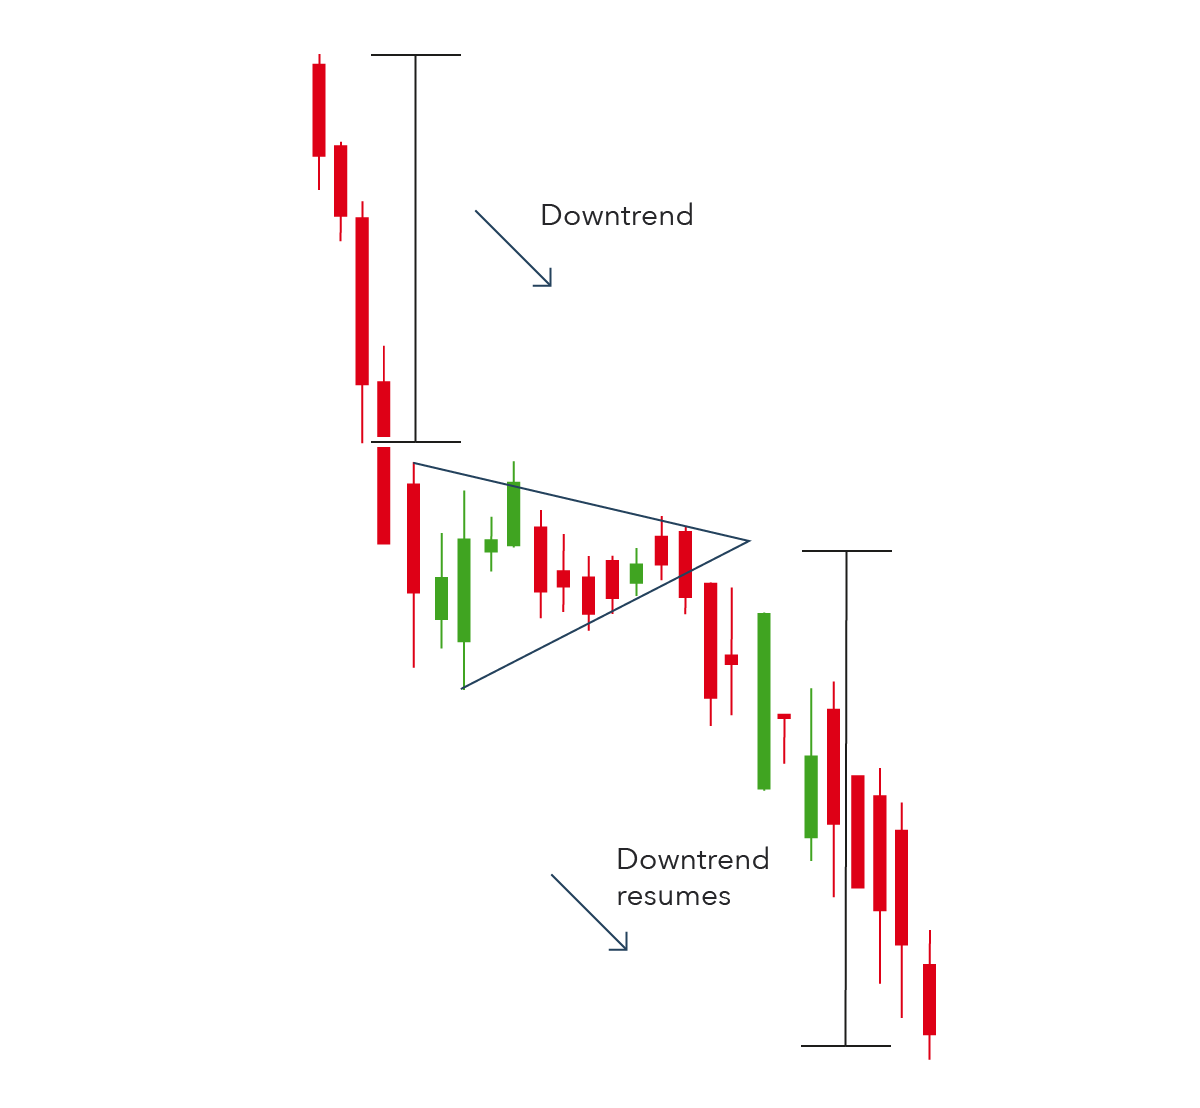
SYMMETRICAL TRIANGLE
The symmetrical triangle pattern can be either bullish or bearish, depending on the market. In either case, it is normally a continuation pattern, which means the market will usually continue in the same direction as the overall trend once the pattern has formed.
Symmetrical triangles form when the price converges with a series of lower peaks and higher troughs. In the example below, the overall trend is bearish, but the symmetrical triangle shows us that there has been a brief period of upward reversals.
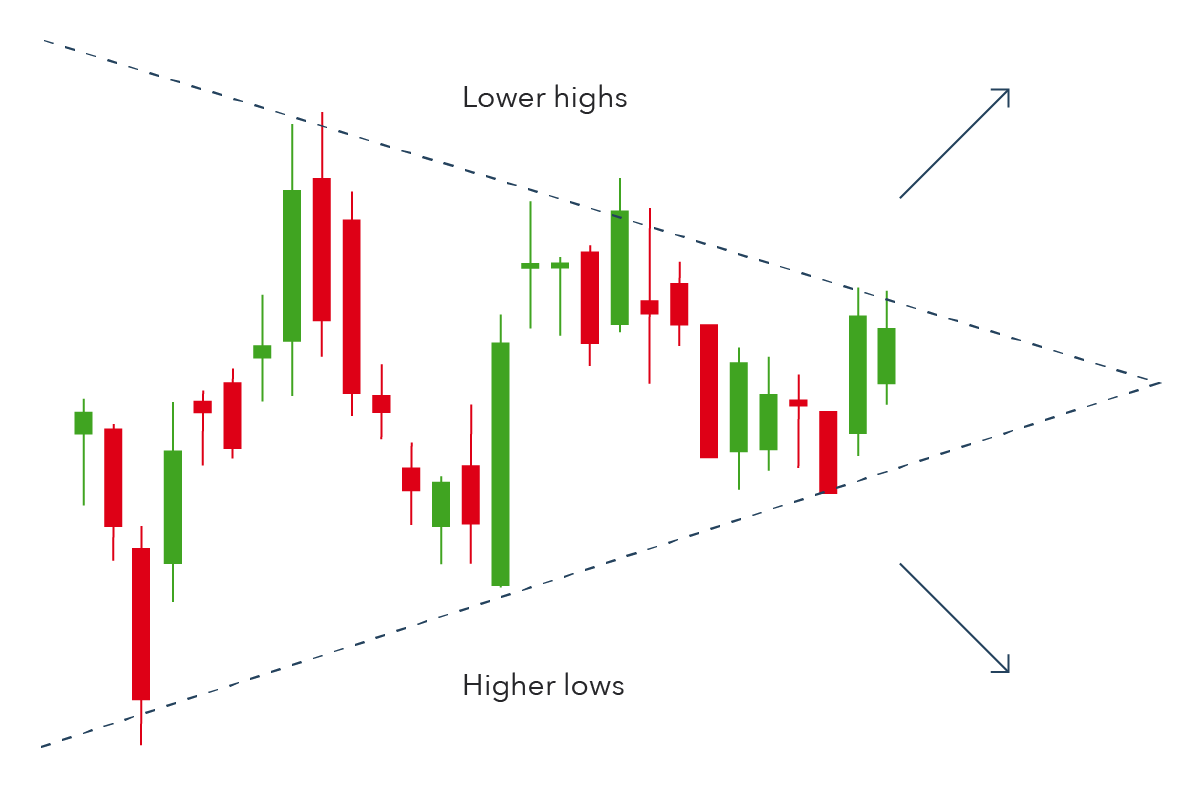
However, if there is no clear trend before the triangle pattern forms, the market could break out in either direction. This makes symmetrical triangles a bilateral pattern – meaning they are best used in volatile markets where there is no clear indication of which way an asset’s price might move. An example of a bilateral symmetrical triangle can be seen below.
SUMMARY
Absolutely, chart patterns are indeed valuable technical indicators that assist traders in comprehending the past and potential future movements of an asset’s price. They achieve this by revealing critical areas of support and resistance in the price history of an asset. Understanding these areas of support and resistance is crucial for traders when making decisions about opening long (buy) or short (sell) positions, as well as deciding when to exit or adjust their existing positions.
Here’s how chart patterns provide this insight:
1. Support and Resistance: Chart patterns help identify levels at which an asset’s price has historically struggled to move above (resistance) or has been supported from falling further (support). Recognizing these levels is essential because they often play a significant role in price movements.
2. Decision-Making: Traders can use the presence of these support and resistance levels, as identified by chart patterns, to make informed trading decisions. For instance, if a bullish continuation pattern suggests that an asset is likely to rise and it encounters support at a specific level, a trader may consider opening a long position. Conversely, if a bearish reversal pattern indicates that a trend change is probable and resistance is evident at a particular level, a trader might consider initiating a short position.
3. Trend Reversal: Chart patterns can also offer insights into potential trend reversals. When a reversal pattern is identified in the price chart and it aligns with critical support or resistance levels, it can be a powerful signal for traders to consider closing or adjusting their positions in anticipation of a change in market direction.
In summary, chart patterns provide traders with a visual representation of an asset’s price behavior and enable them to make well-informed decisions about market entry, exit, and adjustment strategies. By identifying areas of support and resistance and paying attention to the patterns formed, traders can enhance their ability to predict and respond to price movements effectively.


Off, congratulations on this post. This is actually definitely remarkable but that’s why you constantly
crank out my close friend. Great blog posts that our team may sink our
teeth in to and also definitely head to work.
I adore this blogging site message and you recognize you’re.
Writing a blog can be incredibly overwhelming for a lot of
folks due to the fact that there is actually so much entailed however its like anything else.
Terrific portion and thanks for the mention listed below, wow …
How cool is actually that.
Off to share this article currently, I want
all those new blog owners to view that if they do not presently
have a plan 10 they perform right now.
Saved as a favorite, I really like your site!
This is very interesting, You’re a very skilled blogger.
I have joined your feed and look forward to seeking more of your wonderful post.
Also, I have shared your site in my social networks!
Awesome issues here. I am very happy to look your article.
Thank you a lot and I am having a look forward to contact you.
Will you kindly drop me a e-mail?
My spouse and I stumbled over here different web address and thought I might check
things out. I like what I see so now i am following you.
Look forward to looking into your web page again.
That is very attention-grabbing, You are an overly skilled
blogger. I’ve joined your feed and look forward to looking for more of your wonderful
post. Additionally, I’ve shared your site in my social
networks
Thanks for some other magnificent post. The place else may just anyone get that kind of info in such
an ideal approach of writing? I have a presentation subsequent week, and I am at
the look for such info.
continuously i used to read smaller articles or reviews which as well clear
their motive, and that is also happening with this post which I am reading here.
What a material of un-ambiguity and preserveness of precious know-how about unpredicted feelings.
First of all I want to say excellent blog! I had a quick question that I’d like to ask if
you don’t mind. I was curious to find out how you center yourself
and clear your head prior to writing. I’ve had trouble clearing my mind in getting my thoughts
out there. I do take pleasure in writing however it
just seems like the first 10 to 15 minutes are wasted
simply just trying to figure out how to begin. Any suggestions
or tips? Appreciate it!
A blog site is interactive as well as it is consequently that generating income blogging is obtainable. On a blog site you can talk about on your niche development, share with your target audience concerning your business and also much more so get sights from your prospective customers on exactly how you can improve your product or services. As this things I have actually pointed out happen, you will eventually start experiencing complimentary site web traffic thus make money blogging.
Hi everyone, it’s my first pay a quick visit at this web page, and
paragraph is in fact fruitful designed for me, keep
up posting these articles or reviews.
These are truly great ideas in on the topic of blogging.
You have touched some good points here. Any way keep up wrinting.
Hello my loved one! I wish to say that this article is awesome,
nice written and include approximately all significant infos.
I would like to look extra posts like this .
you are really a just right webmaster. The site loading speed is amazing.
It sort of feels that you’re doing any distinctive trick.
In addition, The contents are masterpiece. you have performed a
magnificent task in this subject!
I just like the helpful information you provide in your articles
Can I simply say what a comfort to find a person that really knows what they are discussing on the net.
You definitely understand how to bring a problem to light and make
it important. More and more people have to check this out
and understand this side of your story. I can’t believe you
are not more popular given that you surely possess the
gift.
I like what you guys tend to be up too. Such clever work and coverage!
Keep up the amazing works guys I’ve you guys to
my personal blogroll.
Heya i’m for the first time here. I found this board and I to find
It truly useful & it helped me out a lot.
I’m hoping to give something back and help others like you
helped me.
This is a topic which is close to my heart… Many thanks! Exactly where are
your contact details though?
I’ll right away snatch your rss feed as I can’t find your e-mail subscription hyperlink
or newsletter service. Do you have any? Please allow me know in order
that I may subscribe. Thanks.
Hi there, I found your site by way of Google at the same time as searching for a comparable subject, your web
site got here up, it appears good. I’ve bookmarked it in my google bookmarks.
Hi there, just was alert to your weblog via Google, and located
that it’s truly informative. I am going to watch
out for brussels. I’ll appreciate in the event you continue this in future.
A lot of other people shall be benefited from your writing.
Cheers!
Someone essentially help to make severely posts I might state.
This is the first time I frequented your web page and so far?
I amazed with the research you made to create this particular submit extraordinary.
Wonderful activity!
Hi there everyone, it’s my first pay a quick visit at this web site, and paragraph
is in fact fruitful designed for me, keep up posting these types of articles or reviews.
Hi, just wanted to mention, I enjoyed this post. It was helpful.
Keep on posting!
When someone writes an paragraph he/she keeps the image of a user in his/her mind that how a user can know it.
Thus that’s why this post is amazing. Thanks!
Ridiculous story there. What occurred after? Thanks!
I’m not that much of a internet reader to be honest but
your blogs really nice, keep it up! I’ll go ahead and bookmark your site
to come back later. Many thanks
Great article, exactly what I wanted to find.
I like what you guys are usually up too. This type of clever work and exposure!
Keep up the terrific works guys I’ve incorporated you
guys to my personal blogroll.
I love your blog.. very nice colors & theme.
Did you create this website yourself or did you hire someone to do
it for you? Plz reply as I’m looking to create my own blog and would like to find out
where u got this from. thanks