PAKISTAN ECONOMY
- PKR InterBank: The Pakistani Rupee (PKR) in the interbank market stood at 278.5097 on June 14, 2024, compared to 278.2000 on June 7, 2024.
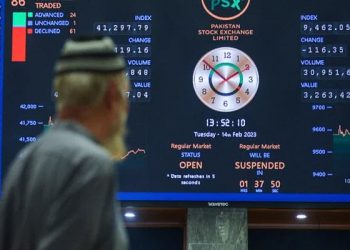
- KSE-100 Index: The Karachi Stock Exchange 100 Index closed at 76,706.77 on June 14, 2024, up from 73,754.02 the previous week.
- Average Daily Volume: The average daily trading volume was 409,553,374 shares, down from 423,316,036 shares the previous week.
- Gold (Karachi) Rs/10 gm: The price of gold in Karachi was Rs207,047 per 10 grams, slightly lower than Rs208,333 the week before.
- KIBOR 6M: The 6-month Karachi Interbank Offered Rate (KIBOR) was 20.11%, down from 20.70%.
- 10-Year PIB: The 10-year Pakistan Investment Bond (PIB) yield was 14.05%, slightly down from 14.13%.
- EUR: The Euro to USD exchange rate was 1.0705, down from 1.0806.
- GBP: The British Pound to USD exchange rate was 1.2687, down from 1.272.
- CHF: The Swiss Franc to USD exchange rate was 0.8901, down from 0.8965.
- JPY: The Japanese Yen to USD exchange rate was 157.399, up from 156.738.
- CNY: The Chinese Yuan to USD exchange rate was 7.2553, up from 7.2461.
- Gold (USD per ounce): The international gold price was $2,333.05 per ounce, up from $2,293.71.
- Silver (USD per ounce): The international silver price was $29.572 per ounce, up from $29.172.
Open Market Rates
- USD: The open market rate for the US Dollar was Rs280.25 for buying and Rs280.00 for selling.
- EUR: The Euro was Rs296.87 for buying and Rs303.35 for selling.
- GBP: The British Pound was Rs352.84 for buying and Rs356.09 for selling.
- JPY: The Japanese Yen was Rs1.77 for buying and Rs1.79 for selling.
- AED: The UAE Dirham was Rs75.55 for buying and Rs75.99 for selling.
- SAR: The Saudi Riyal was Rs73.49 for buying and Rs74.22 for selling.
SBP Data
- T-Bill Auction Cutoff Yield (June 12, 2024 vs May 29, 2024):
- 3 months: 20.1498% down from 21.0001%
- 6 months: 19.9693% down from 21.0000%
- 12 months: 18.9489% down from 20.1001%
- PIB Auction Cutoff Yield (May 22, 2024 vs April 16, 2024):
- 3 years: 16.6450% down from 16.6500%
- 5 years: 15.4500% down from 15.4800%
- 10 years: 14.2999% down from 14.3500%
- No bids were received for 15, 20, and 30-year bonds.
- Interest Rate Corridor (June 11, 2024 vs June 27, 2023):
- SBP Policy Rate: 20.50% down from 22.00%
- SBP Reverse Repo Rate: 21.50% down from 23.00%
- SBP Repo Rate: 19.50% down from 21.00%
PAKISTAN ECONOMY
Weekly Indicators
- SBP FX Reserves (June 7, 2024 vs May 31, 2024): $9,103.30 million, down from $9,109.50 million.
- Bank FX Reserves (June 7, 2024 vs May 31, 2024): $5,280.50 million, up from $5,106.10 million.
- Total FX Reserves (June 7, 2024 vs May 31, 2024): $14,383.80 million, up from $14,215.60 million.
- SPI (Combined Group) (June 13, 2024 vs June 6, 2024): 313.93, up from 309.91.
- Weekly Change: 1.30% up from 0.45%
- Yearly Change: 23.03% up from 21.69%
Monthly Indicators
- Consumer Price Index (May vs April): 254.78 down from 263.32
- Monthly Change: -3.24% down from -0.43%
- Yearly Change: 11.76% down from 17.34%
- Wholesale Price Index (May vs April): 307.70 down from 315.74
- Monthly Change: -2.55% down from 0.70%
- Yearly Change: 9.93% down from 13.88%
- Sensitive Price Indicator (May vs April): 310.91 down from 323.96
- Monthly Change: -4.03% down from -0.03%
- Yearly Change: 22.00% down from 28.77%
- Trade Balance (May vs April):
- Exports: $2,840 million up from $2,351 million
- Imports: $4,948 million up from $4,846 million
- Trade Balance: -$2,108 million up from -$2,495 million
- Home Remittances (May vs April): $3,242.90 million up from $2,813.27 million.
- Total Foreign Investment (April vs March): -$604.71 million down from $311.20 million.
- Current Account Balance (April vs March): $491.00 million up from $434.00 million.
- REER Index (April vs March): 104.5122 up from 104.0949
- Monthly Change: 0.40% down from 1.96%
- Yearly Change: 22.15% up from 21.60%
- Large Scale Manufacturing Index (April vs March): 106.35 down from 115.78
- Monthly Change: -8.14% down from -9.12%
- Yearly Change: 5.76% up from 2.28%
Quarterly Indicators
- Pakistan’s External Debt (March 31, 2024 vs December 31, 2023): $130,401.70 million down from $131,446.40 million.
- National Accounts – Growth Rates (Q3 FY24 vs Q2 FY24):
- Agriculture: 3.94% down from 5.83%
- Industry: 3.84% up from 0.09%
- Services: 0.83% up from 0.75%
- Total: 2.09% up from 1.79%
PAKISTAN ECONOMY
Annual Indicators
- GDP Growth Rate (FY24 vs FY23): 2.38% up from -0.21%
- Agriculture: 6.25% up from 2.27%
- Manufacturing: 2.42% up from -5.29%
- Commodity Sector: 4.02% up from 0.48%
- Services Sector: 1.21% up from -0.01%
- Budget Deficit (As % of GDP): -3.70% down from -7.90%
- Total Debt & Liabilities (As % of GDP): 91.10%
- Total Debt & Liabilities (Rs Billion): Rs77,104.10 billion
- Trade Balance (July – May FY24 vs FY23): -$21,731.00 million down from -$25,642.00 million
- Worker Remittances (July – May FY24 vs FY23): $27,093.38 million up from $25,145.73 million
- Foreign Investment (July – April FY24 vs FY23): $659.26 million up from $341.39 million
- Current Account Balance (July – April FY24 vs FY23): -$202.00 million up from -$3,920.00 million
- Annual Inflation Rate (July – May FY24 vs FY23): 24.52% down from 29.16%
Note: All monetary amounts are in USD million unless otherwise specified.