

CRACKING THE FIBONACCI SEQUENCE: NATURE’S ARITHMETIC SYMPHONY AND TRADING METHODS
The Fibonacci sequence is a series of numbers where each number is the sum of the two preceding ones, typically starting with 0 and 1. So, it goes like this:
0, 1, 1, 2, 3, 5, 8, 13, 21, …
To explain it further, let’s break it down:
- Start with 0 and 1 as the first two numbers.
- The third number is found by adding the two preceding numbers: 0 + 1 = 1.
- The fourth number is found by adding the second and third numbers: 1 + 1 = 2.
- This process continues, where each subsequent number is the sum of the two numbers before it.
Let’s take a closer look:
- 0 (the first number)
- 1 (the second number)
- 0 + 1 = 1 (the third number)
- 1 + 1 = 2 (the fourth number)
- 1 + 2 = 3 (the fifth number)
- 2 + 3 = 5 (the sixth number)
- 3 + 5 = 8 (the seventh number)
- 5 + 8 = 13 (the eighth number)
- And so on…
So, you can see how each number in the sequence is formed by adding the two numbers before it.
This sequence is fascinating because it appears in many natural phenomena, like the arrangement of leaves on a stem, the branching of trees, and even in the proportions of the human body. It’s like a mathematical pattern that nature loves to follow!
DIFFERENT AREAS
The Fibonacci sequence and its related concepts have applications in various fields, including mathematics, biology, finance, art, and computer science. Here are some examples:
- Mathematics: The Fibonacci sequence is a fundamental concept in number theory and combinatorics. It’s often used as an introductory example in teaching sequences and series. Moreover, the study of Fibonacci numbers leads to interesting mathematical properties and patterns, such as the golden ratio.
- Biology: The Fibonacci sequence appears in various biological structures, such as the arrangement of leaves on a stem, the branching of trees, the arrangement of seeds in a sunflower, and the spiral patterns of shells and pinecones. These natural occurrences of Fibonacci patterns are examples of efficient and optimized growth strategies in nature.
- Finance: Fibonacci retracement levels are widely used in technical analysis to identify potential areas of support and resistance in financial markets. Traders use Fibonacci ratios to predict price movements in stocks, currencies, commodities, and other financial instruments.
- Art and Design: Artists and designers often incorporate Fibonacci sequences and the golden ratio into their work to create aesthetically pleasing compositions. The proportions derived from Fibonacci numbers are believed to be visually appealing and harmonious to the human eye, leading to their use in architecture, photography, graphic design, and other creative endeavors.
- Computer Science: Fibonacci numbers are used in various algorithms and programming tasks. For instance, they are used in dynamic programming algorithms, memoization techniques, and algorithms related to searching and sorting. Additionally, Fibonacci heaps, a type of data structure based on Fibonacci numbers, are used in certain computer science applications for efficient heap operations.
TRADERS
Traders use Fibonacci retracements as a technical analysis tool to identify potential levels of support and resistance in financial markets. Here’s how it works:
- Identifying a Trend: Traders first identify a significant price trend, whether it’s an upward (bullish) trend or a downward (bearish) trend.
- Selecting Swing Points: Once the trend is identified, traders select two extreme points on the chart: a swing high and a swing low. These points should be significant turning points in the price movement.
- Applying Fibonacci Levels: Using these swing points, traders apply Fibonacci retracement levels to the chart. The most common retracement levels used are 23.6%, 38.2%, 50%, 61.8%, and 100%.
- Interpreting Levels: These Fibonacci levels represent potential support and resistance levels where the price may retrace or reverse its direction. In an uptrend, traders look for potential buying opportunities near Fibonacci support levels, while in a downtrend, they look for potential selling opportunities near Fibonacci resistance levels.
- Confirmation with Other Indicators: Traders often combine Fibonacci retracements with other technical indicators or chart patterns to increase the reliability of their analysis. This might include using moving averages, trendlines, or candlestick patterns to confirm potential reversal points indicated by Fibonacci levels.
- Setting Entry and Exit Points: Based on their analysis, traders set entry and exit points for their trades. For example, they might enter a long position (buy) near a Fibonacci support level in an uptrend or enter a short position (sell) near a Fibonacci resistance level in a downtrend. They also set stop-loss orders to manage risk and take-profit levels to lock in profits.
It’s important to note that Fibonacci retracements are not foolproof and should be used in conjunction with other analysis techniques and risk management strategies. They are just one tool in a trader’s toolkit for making informed trading decisions. Additionally, their effectiveness can vary depending on market conditions and the timeframe being analyzed. Traders often experiment with different settings and combine Fibonacci retracements with other tools to find what works best for their trading style.
FIB LEVELS
Fibonacci levels, also known as Fibonacci retracement levels, are key levels derived from the Fibonacci sequence and are used in technical analysis to identify potential support and resistance levels in financial markets. Here’s an explanation of Fibonacci levels:
- 0% (Starting Point): This level represents the starting point of the retracement. It’s typically placed at the lowest point of the trend (swing low) for an uptrend or at the highest point of the trend (swing high) for a downtrend.
- 23.6%: This level is derived from dividing one Fibonacci number by another in the sequence (21 divided by 89), resulting in approximately 0.236. It’s considered a shallow retracement level and is often used as an early indication of potential support or resistance.
- 38.2%: This level is derived from dividing one Fibonacci number by another in the sequence (34 divided by 89), resulting in approximately 0.382. It’s a commonly used retracement level and is considered significant in determining potential reversal points.
- 50%: While not directly derived from the Fibonacci sequence, the 50% level is included as it represents a common retracement level. It’s often considered psychologically significant and may act as strong support or resistance.
- 61.8% (Golden Ratio): This level is derived from dividing one Fibonacci number by another in the sequence (55 divided by 89), resulting in approximately 0.618. It’s known as the golden ratio and is considered one of the most important Fibonacci retracement levels. Price retracements to this level are often seen as significant, indicating strong potential support or resistance.
- 100% (Baseline): This level represents the baseline or starting point of the trend. It’s typically placed at the highest point of the trend (swing high) for an uptrend or at the lowest point of the trend (swing low) for a downtrend. It essentially represents a complete retracement of the prior move.
Traders use Fibonacci levels to identify potential entry and exit points for trades. In an uptrend, they may look to buy near Fibonacci support levels, while in a downtrend, they may look to sell near Fibonacci resistance levels. These levels can also help traders set stop-loss orders to manage risk and take-profit levels to lock in profits.
TRADING EXAMPLES
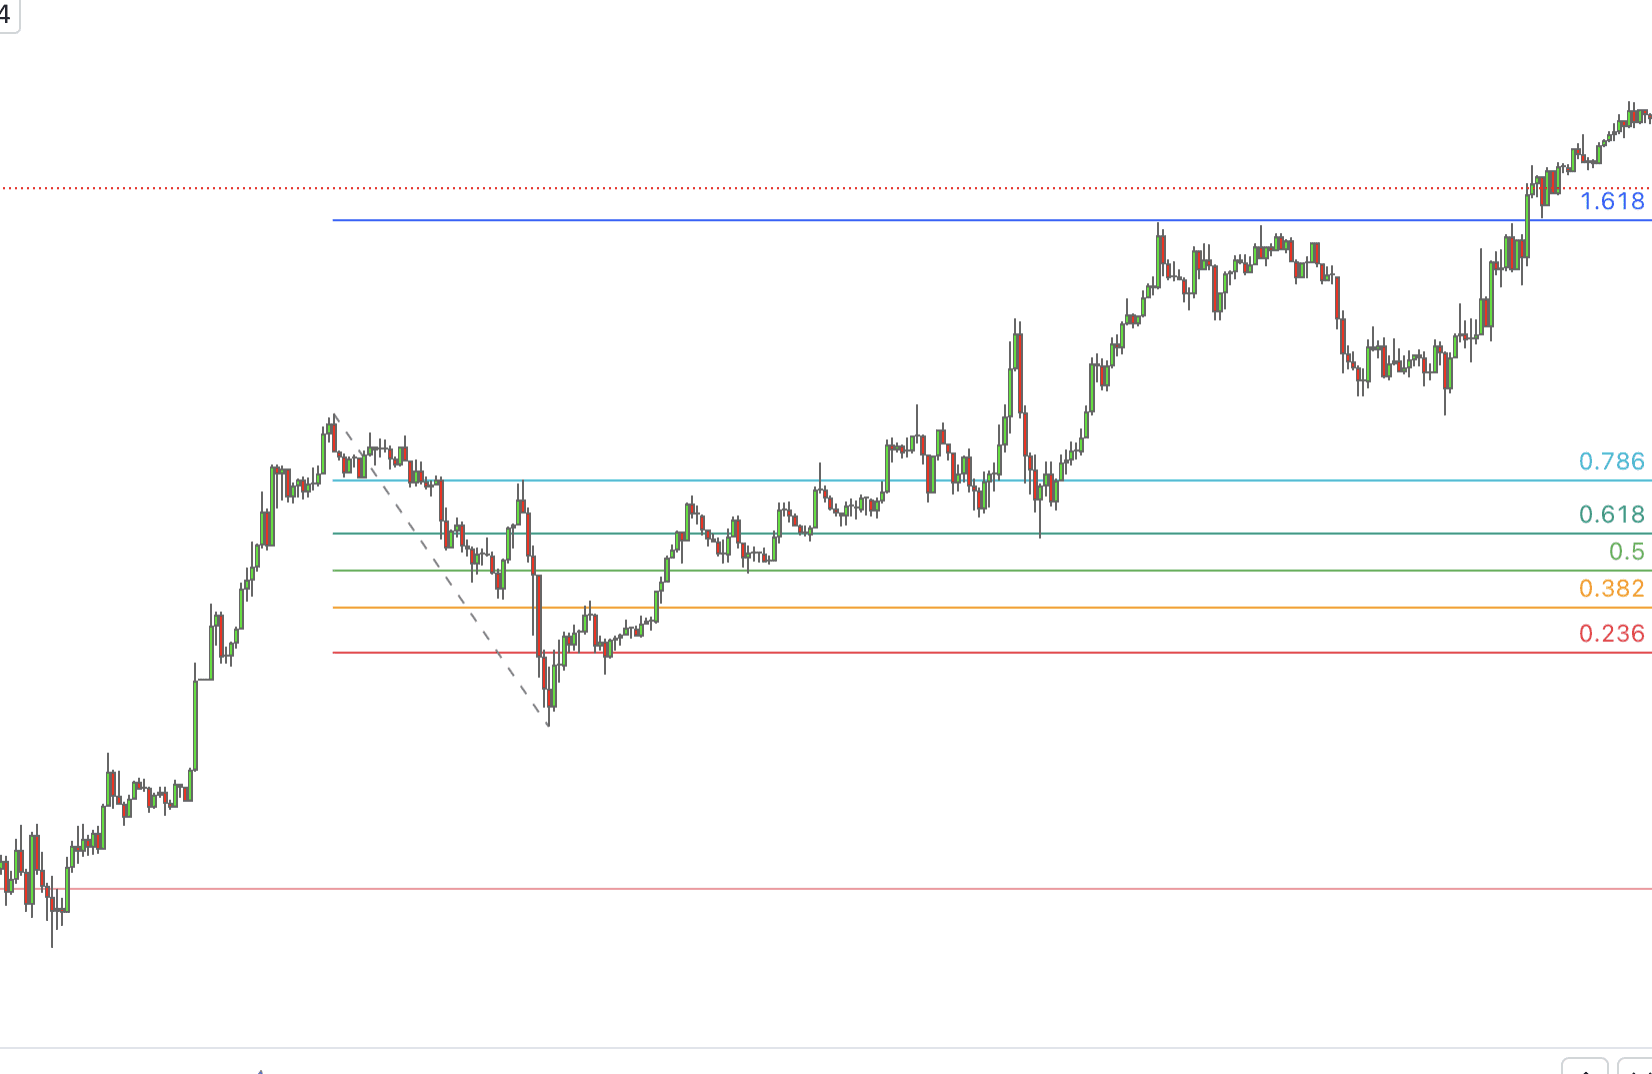
“Top to bottom” and “bottom to top” Fibonacci levels in trading refer to two different approaches of applying Fibonacci retracement levels on a price chart, depending on whether the market is in an uptrend or a downtrend.
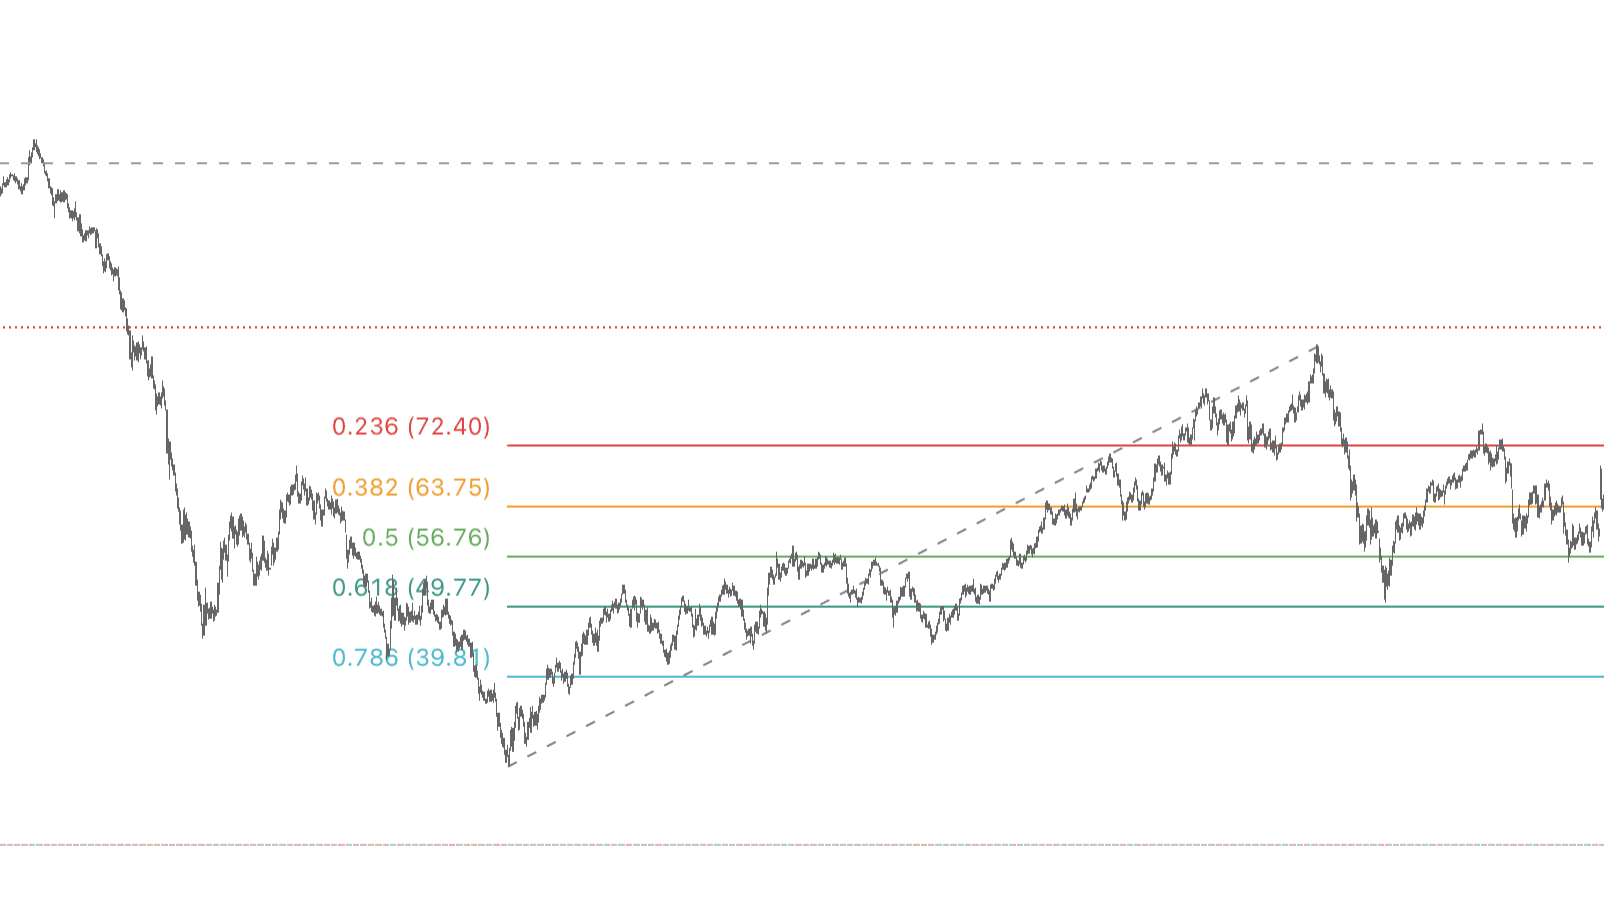
Bottom to Top (Uptrend):
- Identify the Trend: First, identify a significant uptrend in the price movement.
- Select Swing Points: Choose the lowest point (swing low) and the highest point (swing high) of the uptrend. The swing low represents the starting point, and the swing high represents the end point.
- Apply Fibonacci Levels: Apply Fibonacci retracement levels from the swing low to the swing high. This means drawing the Fibonacci retracement tool from the lowest point of the trend to the highest point of the trend.
- Interpret Levels: The Fibonacci retracement levels act as potential support levels in an uptrend. Traders may use these levels to identify areas where the price could potentially retrace before continuing its uptrend. Common retracement levels include 23.6%, 38.2%, 50%, and 61.8%.

Top to Bottom (Downtrend):
- Identify the Trend: First, identify a significant downtrend in the price movement.
- Select Swing Points: Choose the highest point (swing high) and the lowest point (swing low) of the downtrend. The swing high represents the starting point, and the swing low represents the end point.
- Apply Fibonacci Levels: Apply Fibonacci retracement levels from the swing high to the swing low. This means drawing the Fibonacci retracement tool from the highest point of the trend to the lowest point of the trend.
- Interpret Levels: The Fibonacci retracement levels act as potential resistance levels in a downtrend. Traders may use these levels to identify areas where the price could potentially retrace before continuing its downtrend. Common retracement levels include 23.6%, 38.2%, 50%, and 61.8%.
In both cases, traders use Fibonacci retracement levels to anticipate potential areas of support or resistance where the price may react or reverse direction. These levels can help traders identify entry and exit points, set stop-loss orders, and manage risk in their trades.
Our content is intended to be used and must be used for informational purposes only. It is very important to do your own analysis before making any investment based on your own personal circumstances.